Population vs Sample
TLDRThe video script introduces fundamental concepts of statistical analysis, emphasizing the distinction between populations and samples. It explains that while populations encompass all items of interest, samples are subsets that can be more easily studied due to time and resource constraints. The importance of obtaining random and representative samples is highlighted, as these accurately reflect the larger population. The video also touches on the challenges of defining populations and drawing representative samples, suggesting the use of statistical tests to mitigate minor sampling errors.
Takeaways
- 📊 Understanding the difference between population (N) and sample (n) is crucial in statistical analysis.
- 🎯 Parameters are derived from a population, while statistics come from a sample.
- 🏫 The population in a study should encompass all relevant subjects, not just the easily accessible ones.
- 🔬 A sample should be both random and representative to accurately reflect the entire population.
- 🍽️ Choosing a sample based on convenience, like interviewing students in a university canteen, may lead to bias.
- 🥼 Randomness in sampling means every member of the population has an equal chance of being selected.
- 🏢 Representativeness ensures that the sample mirrors the diversity and characteristics of the population.
- 📋 Proper sampling often requires access to comprehensive lists or databases to avoid bias.
- ⏰ Time and resources are significant factors that make sampling more attractive than studying an entire population.
- 📈 Despite challenges in sampling, statistical tests can help mitigate the impact of minor sampling errors.
- 🎓 Gaining experience and knowledge in statistics will make dealing with populations and samples easier over time.
Q & A
What is the primary difference between a population and a sample in statistical analysis?
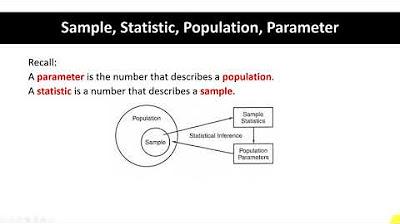
-A population is the entire collection of items of interest in a study, denoted by an uppercase N, while a sample is a subset of the population, denoted by a lowercase n.
What are parameters in the context of statistical analysis?
-Parameters are the numerical values obtained when analyzing a population.
What are statistics in the context of statistical analysis?
-Statistics are the numerical values obtained when working with a sample.
Why is it important for a sample to be random in statistical analysis?
-A random sample ensures that each member of the population has an equal chance of being selected, which helps to avoid bias and provide a more accurate representation of the population.
What does it mean for a sample to be representative?
-A representative sample accurately reflects the characteristics of the entire population, ensuring that the results from the sample can be generalized to the population as a whole.
What is the main advantage of using a sample instead of an entire population in statistical analysis?
-Sampling is less time-consuming and less costly than analyzing an entire population, making it a more practical approach for researchers with limited resources.
How might the sample of students interviewed in the university canteen be biased?
-The sample would be biased because it only includes students who happen to be on campus and in the canteen during lunchtime, excluding those who are off-campus, on exchange, studying abroad, or not having lunch in the canteen.
What is one way to ensure a sample is both random and representative?
-Accessing a comprehensive database and contacting individuals in a completely random manner would ensure the sample is both random and representative.
Why is it not always a problem to make a small mistake while sampling?
-Statistical tests are designed to work with incomplete data, so small errors in sampling can often be accounted for and do not significantly impact the overall validity of the analysis.
What is the main challenge in defining and observing populations in real life?
-Populations are hard to define and observe because they can be large, diverse, and spread out across various locations, making it difficult to collect data from every single member.
How can the concept of populations and samples be easier to understand after taking a course in statistics?
-A course in statistics provides practical experience and theoretical knowledge that helps learners understand the concepts of populations and samples, including how to properly select and analyze them.
Outlines
📊 Understanding Population vs. Sample
This paragraph introduces the fundamental concepts of population and sample in statistical analysis. A population is the entire set of items relevant to a study, denoted by an uppercase 'N', and the data collected from it are called parameters. On the other hand, a sample is a smaller subset of the population, denoted by a lowercase 'n', and the data obtained from it are referred to as statistics. The example of surveying job prospects of students at New York University illustrates the difference between the two. The paragraph also discusses the challenges in defining and observing populations in real life, the ease of contacting and observing samples, and the importance of time and resources in preferring samples over populations.
Mindmap
Keywords
💡Statistical Analysis
💡Population
💡Parameters
💡Sample
💡Statistics
💡Random Sample
💡Representative Sample
💡Sampling
💡Job Prospects
💡Database
💡Statistical Tests
Highlights
The importance of distinguishing between a population and a sample is emphasized at the beginning of the transcript.
A population, denoted by an uppercase N, includes all items of interest for a study, and is represented by parameters.
A sample, denoted by a lowercase n, is a subset of the population and is represented by statistics.
The field of statistics gets its name from the study of samples rather than populations.
An example is provided to illustrate the concept of population, specifically regarding NYU students.
The challenge of defining and observing populations in real life is discussed.
Samples are easier to contact, less time-consuming, and less costly than analyzing entire populations.
The process of drawing a sample from the NYU campus canteen is described, highlighting the issues with non-random and non-representative samples.
A random sample is defined as one where each member is chosen strictly by chance, ensuring equal likelihood of selection.
Representativeness of a sample is determined by its ability to accurately reflect the entire population.
The transcript suggests a method for drawing a random and representative sample: using a student database for random contact.
Despite the difficulties in defining populations and sampling, experience can help in recognizing representative samples.
Statistical tests are designed to work with incomplete data, which can mitigate small sampling errors.
The transcript assures that understanding populations and samples will become easier with the completion of the course.
The transcript concludes with encouragement for the viewer to keep up the good work.
Transcripts
Browse More Related Video

population sample parameter statistic | Gourav Manjrekar

Sample, Statistic, Population, Parameter Part 1

Statistics: Populations & Samples and Parameters vs Statistics

Populations, Samples, Parameters, and Statistics

Introductory Statistics Lecture 1 Introduction and Chapter 1 Part 1

Research Methods 1: Sampling Techniques
5.0 / 5 (0 votes)
Thanks for rating: