Introductory Statistics Lecture 1 Introduction and Chapter 1 Part 1
TLDRIn this introductory statistics lecture, Mark Ledbetter explores the exciting realm of statistics, highlighting its power to uncover insights from small samples about any population. He differentiates between descriptive and inferential statistics, emphasizing the latter's role in drawing conclusions from samples. The lecture outlines the course, touches on various statistical areas of expertise, and introduces fundamental concepts like observational studies, experimental designs, and key terms related to populations, samples, and parameters. Ledbetter also stresses the importance of understanding vocabulary and notation for effective statistical analysis.
Takeaways
- 📚 Introduction to Statistics: The study involves data collection, organization, summarization, presentation, analysis, interpretation, and drawing conclusions from data.
- 🌟 Exciting Aspect of Statistics: It allows the discovery of information about any population using small samples, without needing explicit formulas or laws governing the situation.
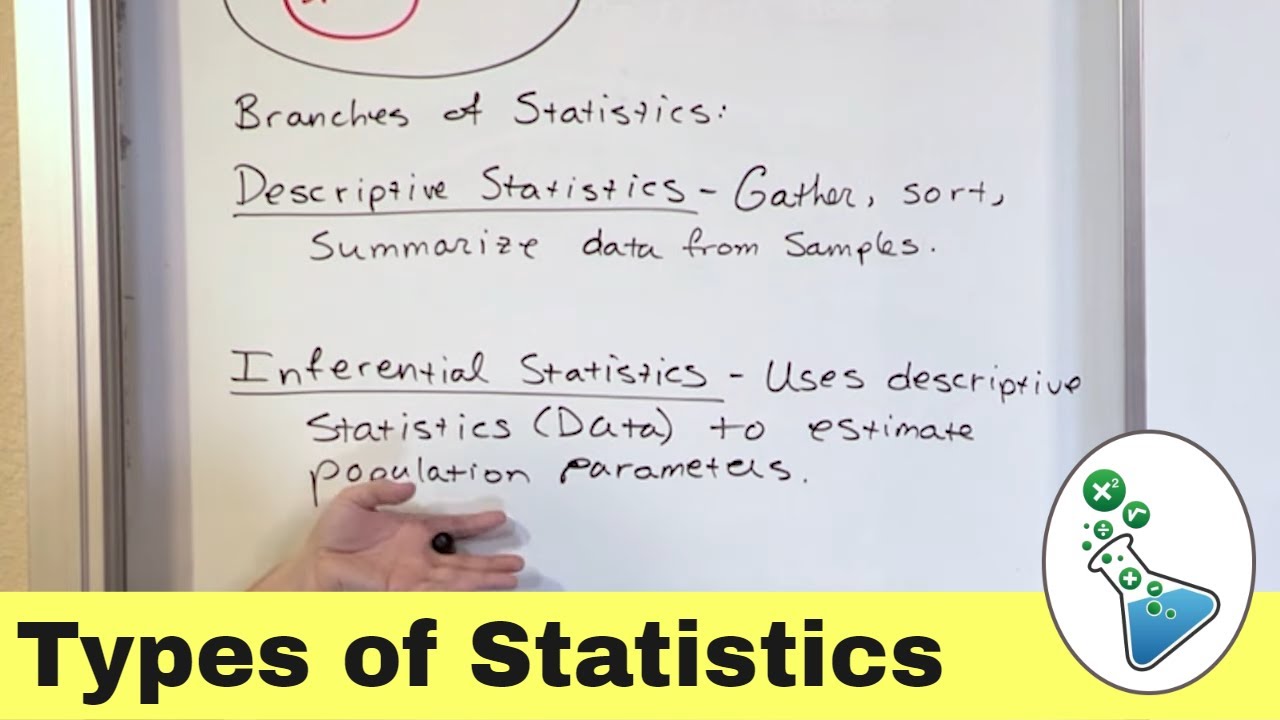
- 📈 Two Main Areas: Descriptive statistics (organizing and summarizing data) and Inferential statistics (drawing conclusions about the population from a sample).
- 🔢 Importance of Descriptive Statistics: Necessary for understanding data before moving to inferential analysis, and crucial for avoiding errors in statistical inferences.
- 🎯 Sampling Techniques: Random sampling ensures every individual in the population has an equal chance of being selected, while simple random sampling focuses on equal probability for any group of individuals.
- 🔍 Statistical Analysis Process: Involves selecting a sample, performing calculations, and using statistical techniques to make inferences about the population.
- 📊 Data Terminology: 'Individual' refers to a member of the population, 'variable' is something that varies in value, 'population data' is from the entire population (census), and 'sample data' is from a subset.
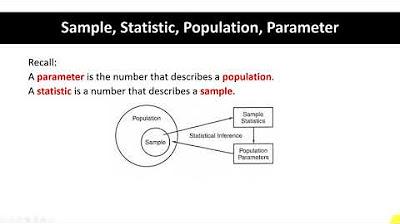
- 🔑 Parameters vs. Statistics: Parameters are true values of a population (e.g., average length of fireflies in a city), while statistics are measures from a sample.
- 📚 Course Outline: The semester will cover basic statistics concepts, focusing on chapters 1-4, 7-9, and as much of chapters 10 and 11 as possible.
- 📝 Assignments and Participation: Students are required to take lecture notes for each video, scan them into Google Drive for participation grade, and use them for studying and completing assignments.
- 🔍 Observational vs. Experimental Studies: Observational studies analyze data without researcher interference, while experimental designs control conditions to test cause and effect relationships.
Q & A
What is the main focus of this introductory statistics course?
-The main focus of this course is to introduce the study of statistics, including basic vocabulary, descriptive and inferential statistics, and various areas of expertise within statistics.
What are the two areas of statistics mentioned in the video?
-The two areas of statistics mentioned are descriptive statistics, which involves organizing and summarizing data, and inferential statistics, which is about drawing conclusions about a population from a sample.
How does the process of statistics differ from other sciences like physics?
-Unlike physics, which relies on known formulas and laws, statistics allows us to study situations without a clear understanding of the underlying equations or laws, making it a powerful tool for discovery.
What is the significance of probability in the study of statistics?
-Probability is the foundation of statistics. It is a mathematically involved and complex area of expertise that is essential for understanding and applying statistical methods.
What are the two basic types of studies in statistics?
-The two basic types of studies are observational studies, where data is analyzed without researcher interference, and experimental designs, where researchers control conditions to test cause and effect.
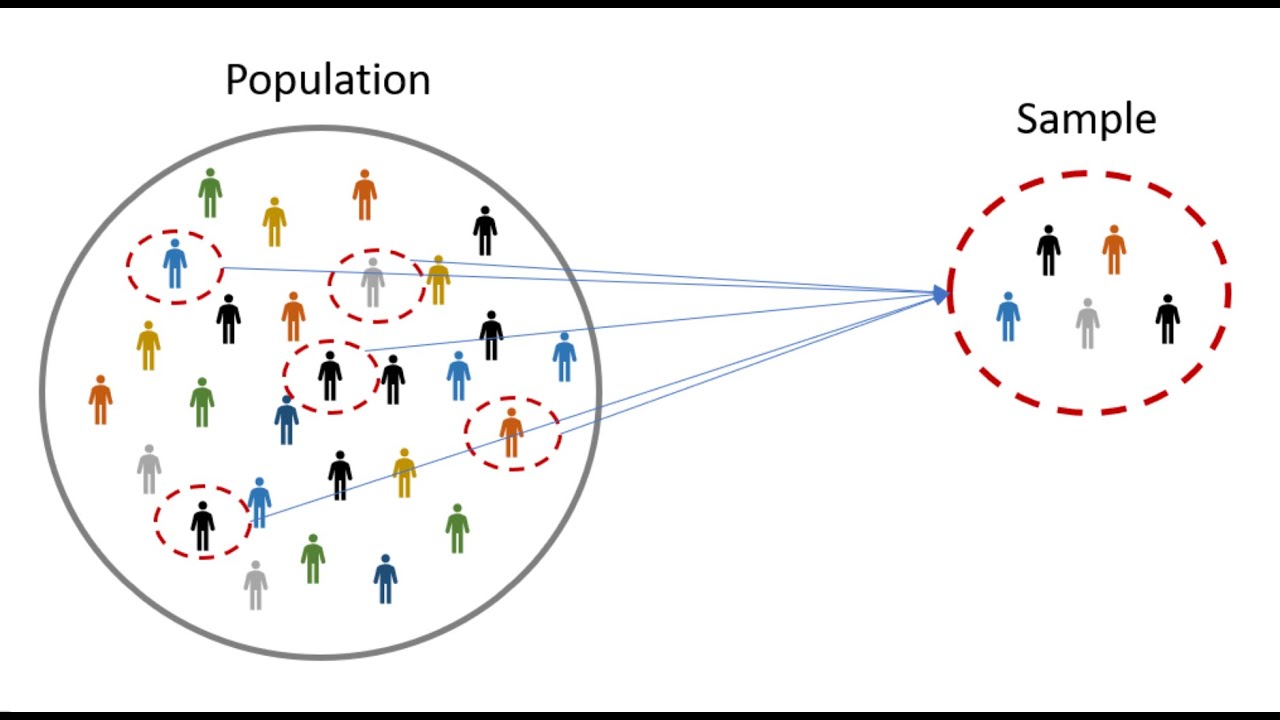
What is the difference between a population and a sample in statistics?
-A population is the entire group of interest, while a sample is a subset of the population that is selected for study.
What is a parameter in the context of statistics?
-A parameter is a true value that characterizes the population, such as the mean or standard deviation of the entire population.
What is a statistic in the context of statistics?
-A statistic is a measure on a sample that estimates or represents the corresponding parameter of the population.
How does the instructor plan to engage students with the course material?
-The instructor requires students to take lecture notes on each video, scan them, and upload them to a shared Google Drive. This practice is intended to aid in studying and is part of the participation grade.
What is the course outline for this semester?
-The course will cover chapters one through four, skip to chapters seven through nine, and then cover as much of chapters 10 and 11 as possible from the book 'Understanding Basic Statistics' by Braid and Braid, seventh edition.
What is an example of how statistics can be applied in the real world?
-An example is studying the average length of fireflies in Lynchburg, Virginia by selecting random grids, capturing and measuring fireflies, and then releasing them, to draw conclusions about the population.
Outlines
📚 Introduction to the World of Statistics
This paragraph introduces the speaker, Mark Ledbetter, and sets the stage for the statistics series. He explains the broad definition of statistics as a science involving data collection, organization, summarization, presentation, planning, experiment performance, data analysis, interpretation of results, and data presentation. The exciting aspect of statistics is highlighted as the ability to discover information about any population using a small sample. The distinction between physics and statistics is made, emphasizing the power of statistics to study unknown underlying laws. The two main areas of statistics, descriptive and inferential, are introduced, with a focus on the latter for drawing conclusions from samples.
📈 Understanding Statistics: Vocabulary and Notation
In this paragraph, the speaker delves into the specifics of statistical vocabulary and notation. He emphasizes the importance of learning new terms and definitions to understand statistical concepts and the extensive use of Greek and English letters in notation. The speaker outlines the textbook 'Understanding Basic Statistics' by Braid and Braid, which will be used throughout the semester. The course will cover chapters 1 through 4, skip to chapters 7 through 9, and then as much of chapters 10 and 11 as possible. The difference between observational studies and experimental designs is explained, with the former being the focus of the course. Various terms related to data, such as individual, variable, population data, census, and sample data, are defined.
🔍 Diving Deeper into Statistical Concepts
The speaker continues to elaborate on key statistical concepts, focusing on the difference between parameters and statistics. Parameters are true values of a population, such as the mean length of fireflies in Lynchburg, Virginia, which are unknown and unmeasurable in their entirety. Statistics, on the other hand, are measures on a sample, like the mean length of the fireflies measured in a sample. The speaker uses the example of studying fireflies in Lynchburg to illustrate how a population and sample are defined and how parameters and statistics are derived from them. The importance of this understanding is emphasized for future inference in the course. The speaker also mentions the requirement of taking lecture notes for each video, which contribute to the participation grade.
Mindmap
Keywords
💡Statistics
💡Descriptive Statistics
💡Inferential Statistics
💡Probability
💡Sampling Theory
💡Population
💡Sample
💡Parameter
💡Statistic
💡Random Sample
💡Simple Random Sample
Highlights
Introduction to the study of statistics by Mark Ledbetter.
Statistics is the science of collecting, organizing, summarizing, presenting, and analyzing data to draw conclusions.
Exciting aspect of statistics is discovering information about any population using small samples.
Two main areas in statistics: descriptive and inferential statistics.
Descriptive statistics involves organizing and summarizing data, often using visual representations.
Inferential statistics involves drawing conclusions about a population from a small sample.
There is always some level of uncertainty in statistical conclusions, but it can be controlled.
Statistics is a broad field with various areas of expertise, including probability, sampling theory, estimation, decision theory, prediction, and modeling.
Probability is the foundation of statistics and is essential for all other areas.
The course will cover basic vocabulary, notation, and concepts before moving on to calculations and inferential statistics.
Two basic types of studies in statistics: observational studies and experimental designs.
Observational studies involve analyzing data without influencing or interfering with the results.
Experimental designs involve controlling conditions to prove or disprove cause and effect.
Key terms related to data: individual, variable, population data, sample data, random sample, and simple random sample.
A parameter is a true value of a population, while a statistic is a measure on a sample.
Example given: studying the average length of fireflies in Lynchburg, Virginia using sampling theory.
The population in the study is all fireflies in Lynchburg, and the sample is the ones captured and measured.
The parameter for the firefly study is the average length of all fireflies in Lynchburg, and the statistic is the average length of the measured sample.
Students are required to take lecture notes and submit them for participation grade.
The course will cover specific chapters from the textbook 'Understanding Basic Statistics' by Braid and Braid.
Transcripts
Browse More Related Video

Chapter 1 - An Intro to Business Statistics
Sample, Statistic, Population, Parameter Part 1
Statistics: Populations & Samples and Parameters vs Statistics
What is Descriptive Vs. Inferential Statistics?

What is Statistics? | Types of Statistics | Descriptive & Inferential Statistics | Acadgild
Statistics Course Overview | Best Statistics Course | MarinStatsLectures
5.0 / 5 (0 votes)
Thanks for rating: