Label & Draw Transersve Waves: Amplitude, Frequency, Wavelength, Crest, and Trough
TLDRThis video script offers a comprehensive guide on understanding and graphing transverse waves, focusing on key wave properties such as amplitude, wavelength, frequency, and the resting position. The explanation is enriched with practical steps for graphing waves, using graph paper, and assigning values for amplitude and wavelength to visually represent cycles over time. The relevance to chemistry is highlighted through the discussion of the electromagnetic spectrum, emphasizing the correlation between wavelength and the visible light spectrum. The video aims to enhance the viewer's ability to label and graph waves, providing a clear and engaging educational experience.
Takeaways
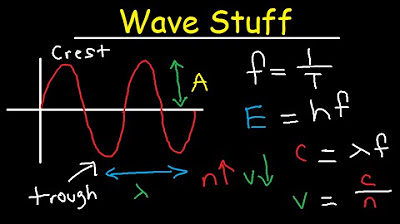
- 📐 The basics of labeling a transverse wave involve identifying its crest, trough, amplitude, wavelength, frequency, and resting position.
- ⏱️ The frequency of a wave is defined as the number of complete cycles that occur in one second.
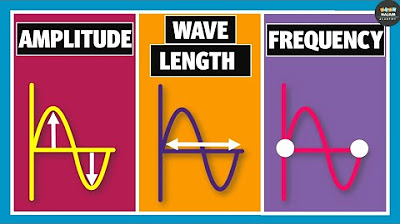
- 🌊 Amplitude is the maximum displacement or distance the wave travels from its resting position, which can be upwards or downwards.
- 🔍 Wavelength is the distance between two consecutive points in the same phase of the wave, such as crest to crest or trough to trough, and is symbolized by λ (lambda).
- 📈 To graph a wave, use graph paper and label the axes with appropriate titles, such as 'displacement' and 'distance'.
- 🎨 When graphing, start by marking the wavelength, then add the amplitude, and finally draw the wave's curve to represent its shape over time.
- 🔄 Ensure that the graph accurately represents the number of cycles (frequency) within the given time frame, such as three cycles in one second.
- 📊 Graphing waves can be applied to various scientific fields, including chemistry, where understanding the relationship between wavelength and energy is crucial.
- 🌞 In chemistry, the visible light spectrum is of particular interest, with longer wavelengths corresponding to red light and shorter wavelengths to violet light.
- 🌈 The electromagnetic spectrum is organized by wavelength, with higher energy (shorter wavelength) types like ultraviolet light and lower energy (longer wavelength) types like infrared light.
- 🔑 Understanding wave properties and their graphical representation is essential for studying phenomena in physics, chemistry, and mathematics.
Q & A
What are the key components of a transverse wave?
-The key components of a transverse wave include the crest, trough, amplitude, wavelength, and resting position.
How is the crest of a transverse wave defined?
-The crest of a transverse wave is the highest point or the peak of the wave, representing the maximum displacement from the resting position.
What is the trough in the context of a transverse wave?
-The trough is the lowest point of a transverse wave, representing the minimum displacement from the resting position, or the point where the wave reaches its lowest value.
What does amplitude represent in a wave?
-Amplitude in a wave represents the maximum displacement or distance from the resting position to the crest or trough. It is a measure of the wave's energy or intensity.
How is the wavelength of a wave defined?
-Wavelength is the distance between two consecutive points in phase, such as from one crest to the next crest or from one trough to the next trough.
What is the resting position in the context of wave labeling?
-The resting position is the equilibrium position that the medium would occupy in the absence of the wave. It is the baseline from which displacements are measured.
How can you determine the frequency of a wave?
-Frequency is determined by the number of complete cycles or oscillations that occur in one second. It can be calculated by observing how many times the wave returns to its resting position within a given time frame.
What is the significance of graphing waves in science?
-Graphing waves is significant in science as it allows for the visual representation and analysis of wave patterns, which can be used to predict and understand various physical phenomena in fields like physics, chemistry, and mathematics.
How does the concept of wavelength relate to chemistry, specifically in the study of light?
-In chemistry, the concept of wavelength is crucial in understanding the electromagnetic spectrum, particularly visible light. Different colors of light have different wavelengths, and by studying these, scientists can identify elements and understand their properties, as in flame tests or emission spectrums.
What is the relationship between wavelength and frequency in a wave?
-The wavelength and frequency of a wave are inversely related. A wave with a longer wavelength will have a lower frequency, and vice versa, a wave with a shorter wavelength will have a higher frequency.
How can you ensure accuracy when graphing waves?
-To ensure accuracy when graphing waves, use a ruler for straight lines, clearly label axes, choose appropriate amplitude and wavelength values for easy graphing, and plot the points accurately to create a smooth wave curve.
What is the significance of understanding wave graphs in various scientific fields?
-Understanding wave graphs is significant in scientific fields as it provides a visual and mathematical representation of wave behavior. This understanding can be applied to many areas, from analyzing sound waves in physics to studying light waves in chemistry, and even to understanding fluctuations in mathematical models.
Outlines
📐 Understanding and Labeling Transverse Waves
This paragraph introduces the process of labeling a transverse wave with key parameters such as crest, trough, amplitude, wavelength, and frequency. It explains the relevance of these waves in various scientific fields like chemistry, physics, and mathematics. The speaker begins by drawing the two axes for the wave, labeling them as displacement and distance, and then proceeds to draw a wave that completes one cycle in one second. The amplitude is defined as the distance from the resting position to the crest or trough, and the wavelength is the distance from one crest to another or from one trough to another. The resting position is also highlighted as an important line on the graph. Lastly, the frequency, which is the number of cycles per second, is calculated based on the time taken for one complete cycle of the wave.
📈 Graphing Transverse Waves and Their Relevance in Chemistry
The second paragraph delves into the practical aspect of graphing transverse waves. It begins by outlining the necessary preparations, such as having graph paper and titling the graph. The speaker then explains how to plot the axes, establish the resting position, and label them with appropriate scientific terms like amplitude and distance. The speaker chooses arbitrary values for amplitude, wavelength, and frequency to demonstrate the graphing process. The graph is constructed by marking the wavelength, amplitude, and plotting the wave's crests and troughs accordingly. The paragraph concludes by connecting the concept of wavelength to chemistry, specifically the visible light spectrum and how different colors correspond to different wavelengths. This connection illustrates the practical application of wave properties in understanding and identifying various types of electromagnetic radiation.
Mindmap
Keywords
💡Transverse Wave
💡Crest
💡Trough
💡Amplitude
💡Wavelength
💡Frequency
💡Resting Position
💡Graphing Waves
💡Science Applications
💡Electromagnetic Spectrum
Highlights
The video begins with an introduction to labeling a transverse wave with key wave properties such as crest, trough, amplitude, wavelength, frequency, and resting position.
Waves are important in various scientific fields including chemistry, physics, and mathematics, and are often represented graphically.
The amplitude of a wave is the maximum displacement or distance moved by the wave from its resting position, and can be represented as the distance from the crest to the trough.
Wavelength is the distance over one cycle of a wave, and is commonly denoted by the symbol lambda (λ). It can be measured from crest to crest or trough to trough.
Resting position is the equilibrium position that a wave passes through during its oscillation, which is a key point to consider when graphing waves.
Frequency refers to the number of complete cycles or oscillations a wave completes in one second, and is a critical aspect of wave analysis.
The video provides a step-by-step guide on how to graph a transverse wave, starting with setting up the graph paper and labeling the axes correctly.
When graphing waves, it's important to first plot the resting position line, followed by marking the amplitude and wavelength points.
The process of graphing waves involves drawing the waveforms with accurate spacing and height to represent the wave's properties visually.
The video demonstrates how to graph multiple cycles of a wave, emphasizing the importance of consistency and accuracy in the representation of the wave's properties.
The concept of wavelength is directly applicable to the study of light in chemistry, particularly in understanding the electromagnetic spectrum.
In chemistry, the wavelength of light is related to its energy, with shorter wavelengths corresponding to higher energy and longer wavelengths to lower energy.
The video connects the theoretical aspects of wave properties to practical applications in science, enhancing the viewer's understanding of the subject matter.
The video concludes by reinforcing the importance of understanding how to label and graph waves, which is crucial for success in related scientific studies.
Transcripts
Browse More Related Video

The Electromagnetic Spectrum Introduction | Study Chemistry With Us

Wavelength, Frequency, Time Period and Amplitude | Physics

All of AQA Waves Explained - A Level Physics REVISION

Transverse and Longitudinal Waves

EM waves: wavelength, amplitude, frequency, and Hertz

Wavelength, Frequency, Energy, Speed, Amplitude, Period Equations & Formulas - Chemistry & Physics
5.0 / 5 (0 votes)
Thanks for rating: