Functions defined by definite integrals (accumulation functions) | AP Calculus AB | Khan Academy
TLDRThe video script introduces a novel method of defining functions through the use of definite integrals. It explains the concept by using an example where a function f(t) is squared if t is odd, and cubed if not. A new function g(x) is then defined as the definite integral of f(t) from -2 to x, effectively calculating the area under the curve of f(t). The script provides a step-by-step breakdown of how to compute g(x) for specific values of x, illustrating the process with a clear and engaging explanation.
Takeaways
- 📚 Functions map inputs to outputs, with the input belonging to the function's domain and the output referred to as f(x).
- 🧮 Functions can be defined in various ways, such as f(x) = x², showing how the output depends on the input.
- 🔢 Conditional function definitions can specify different outcomes based on input characteristics, like f(x) = x² if x is odd, and x³ otherwise.
- 📉 Functions can also be defined using definite integrals, introducing a method to calculate function values based on the area under a curve.
- 📐 The definite integral from a to b of f(t) dt represents the area under the curve of f from a to b.
- 🔍 The function g(x) = ∫ from -2 to x of f(t) dt demonstrates how definite integrals can create new functions based on existing ones.
- 📋 To compute g(x), one evaluates the definite integral with x as the upper limit, interpreting the result as the total area under f(t) from the lower limit to x.
- 📈 Evaluating g(x) at specific points like x = 1 or x = 2 involves calculating the definite integral from the starting point to that x value, summing the areas under the curve.
- 📏 Geometric shapes like rectangles and triangles can help in calculating the area under the curve, facilitating the integral evaluation.
- ✅ Definite integrals offer a powerful tool for defining functions, enabling the representation of accumulated quantities and changes.
Q & A
What is the basic concept of a function in mathematics?
-The basic concept of a function is to take a valid input (from the domain of the function) and produce a corresponding output, which is often denoted as f(x).
How is the function f(x) defined in the example with x squared?
-In the example, the function f(x) is defined such that f(x) = x^2, meaning the output is the square of the input.
What is the alternative definition of the function F(x) provided in the script?
-The alternative definition of F(x) is F(x) = x^2 if x is odd, and F(x) = x^3 otherwise, meaning it squares the input if it's an odd integer and cubes the input for any other real number.
What is the significance of the definite integral in the context of the new function g(x)?
-The definite integral is used to define the new function g(x) as the area under the curve of f(t) from -2 to x, which represents the accumulated effect of the function over that interval.
How is the area under the curve calculated for g(1) in the script?
-For g(1), the area is calculated as a rectangle with an area of 15 square units (3 wide and 5 high) plus a triangle with an area of 1 square unit (2 wide and 1 high, using the formula for the area of a triangle: 0.5 * base * height), totaling 16 square units.
What is the total area calculated for g(2)?
-For g(2), the total area is the previously calculated area for g(1), which is 16 square units, plus the area of a rectangle from t=1 to t=2 (5 wide and 1 high), which is 5 square units, making a total of 21 square units.
How does the definite integral relate to the function values in the context of g(x)?
-The definite integral relates to the function values by summing up the contributions of the function over a specified interval, in this case from -2 to x, and representing this sum as the value of g(x).
What is the role of the t-axis and y-axis in the graph of the function f(t)?
-The t-axis represents the domain (possible values of t) and the y-axis represents the range (possible outputs of the function). The graph of the function f(t) shows how the output values (y) change with respect to the input values (t).
How does the function g(x) differ from the function f(x) in terms of their representation?
-While f(x) directly maps inputs to outputs, g(x) is defined through the accumulation of values from f(t) over an interval, represented by the definite integral from -2 to x, which gives a different perspective on the behavior of the function.
What is the key takeaway from the script about defining functions using definite integrals?
-The key takeaway is that definite integrals can be used to define valid functions, offering a method to represent the accumulated effect of a function over a certain interval, which is a different approach from traditional function definitions.
Outlines
📚 Introduction to Functions and Definite Integrals
The instructor begins by revisiting the concept of functions, a fundamental component in mathematics where a valid input from a function's domain is transformed into a corresponding output, denoted as f(x). Functions can be defined in various ways, such as f(x) = x squared for any input x, or differently for odd integers and other numbers. The video script then transitions to exploring a new method of defining functions through the use of definite integrals, specifically highlighting the process with an example function f(t). A new function, g(x), is introduced, defined by the definite integral from -2 to x of f(t) dt. Through this, the instructor aims to demystify the concept of using definite integrals in function definition, using visual aids and examples to calculate the area under the curve of f(t) for different values of x, thus showcasing how g(x) can be determined for specific inputs.
Mindmap
Keywords
💡functions
💡domain
💡corresponding output
💡definite integral
💡graph
💡area under the curve
💡t-axis
💡y-axis
💡odd integer
💡real number
💡valid way of defining a function
Highlights
Introduction to functions and their basic idea - mapping a valid input to a corresponding output.
Example of defining functions with simple equations.
Introduction of conditional function definitions based on input characteristics.
Defining functions using a definite integral as a new method.
Explanation of the definite integral function setup with `g(x)` representing the area under a curve from a fixed point to `x`.
Description of the graph used for illustrating the definite integral function concept.
Walkthrough on calculating `g(x)` for a specific input using the area under the curve.
Breakdown of calculating the area under the curve by segmenting it into simpler geometric shapes.
Step-by-step calculation of `g(1)` showing the practical application of the definite integral to find function output.
Explanation of how the definite integral represents cumulative area from a starting point to the variable upper limit `x`.
Calculation of `g(2)` to illustrate how `g(x)` changes with different inputs.
Emphasis on the continuous nature of the definite integral function through varying `x` values.
Demonstration of the definite integral's utility in defining functions that accumulate changes over an interval.
Insight into the visualization of function definitions through geometric areas under curves.
Conclusion highlighting the validity of using definite integrals to define functions.
Transcripts
Browse More Related Video

Functions defined by integrals | Accumulation and Riemann sums | AP Calculus AB | Khan Academy
Proof of fundamental theorem of calculus | AP Calculus AB | Khan Academy
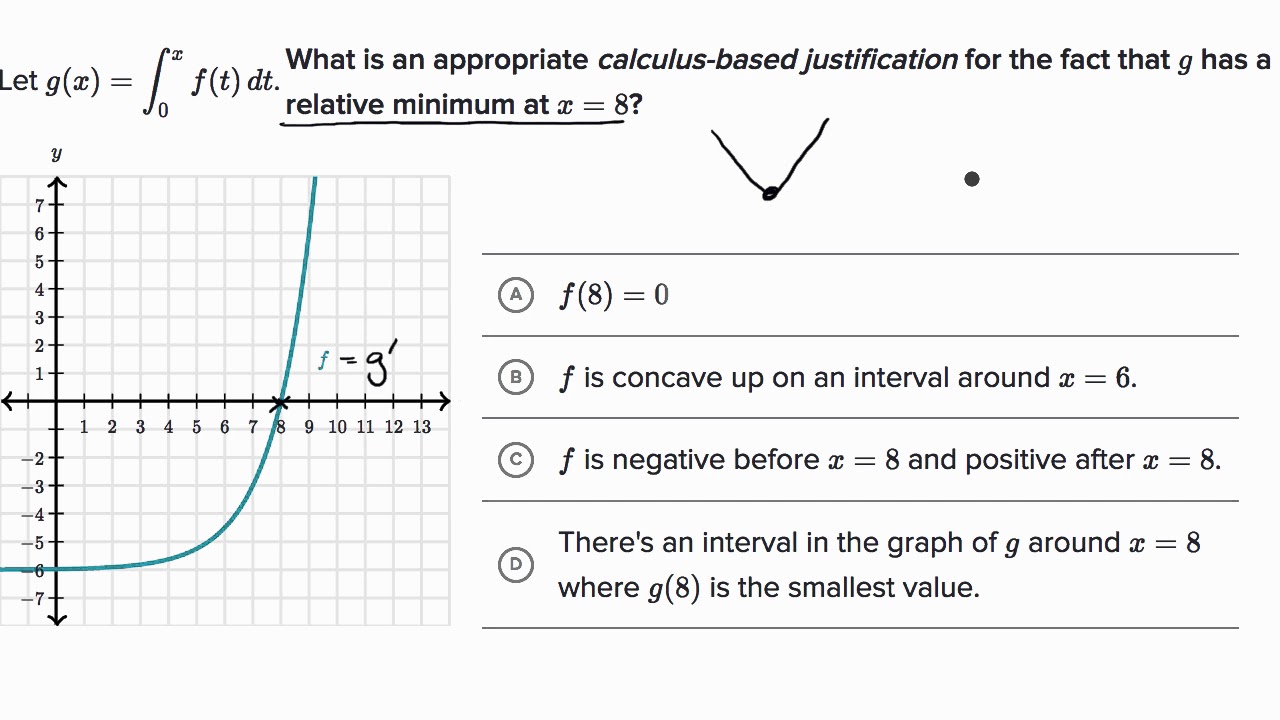
Interpreting behavior of _ from graph of _'=ÃÂ | AP Calculus AB | Khan Academy
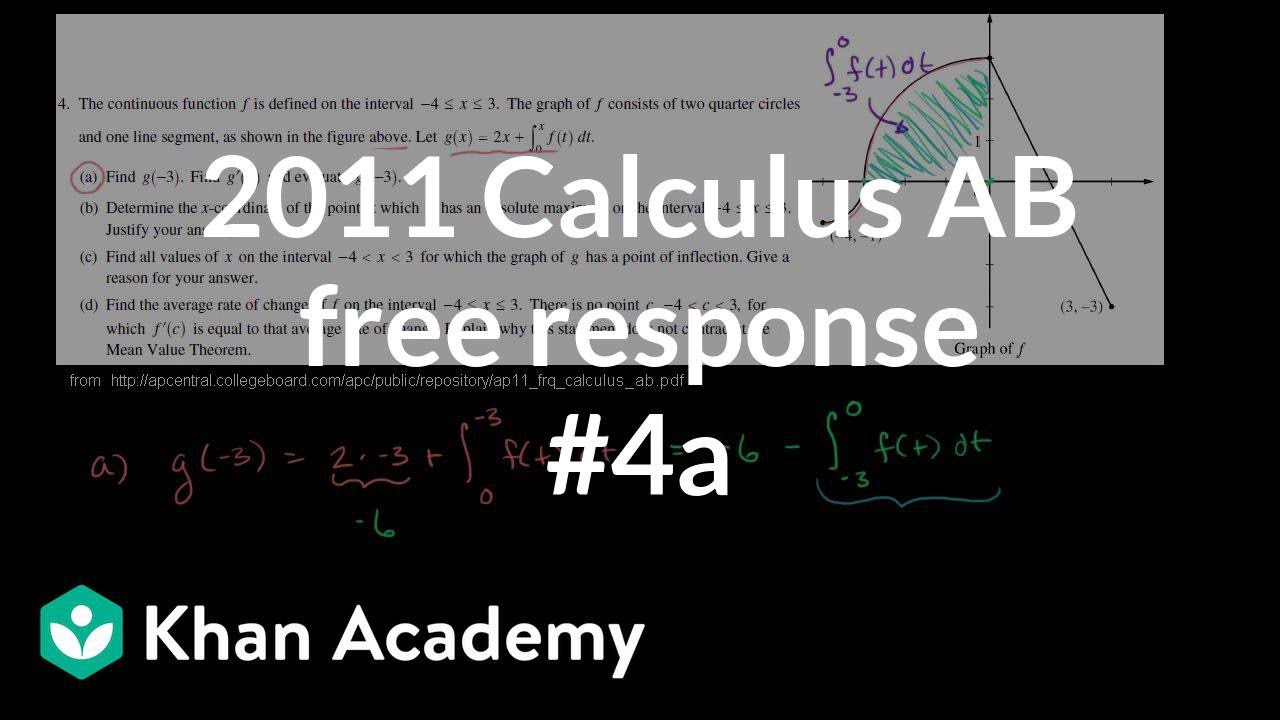
2011 Calculus AB free response #4a | AP Calculus AB | Khan Academy

Fundamental theorem of calculus (Part 2) | AP Calculus AB | Khan Academy
Line integral example 1 | Line integrals and Green's theorem | Multivariable Calculus | Khan Academy
5.0 / 5 (0 votes)
Thanks for rating: