Functions defined by integrals | Accumulation and Riemann sums | AP Calculus AB | Khan Academy
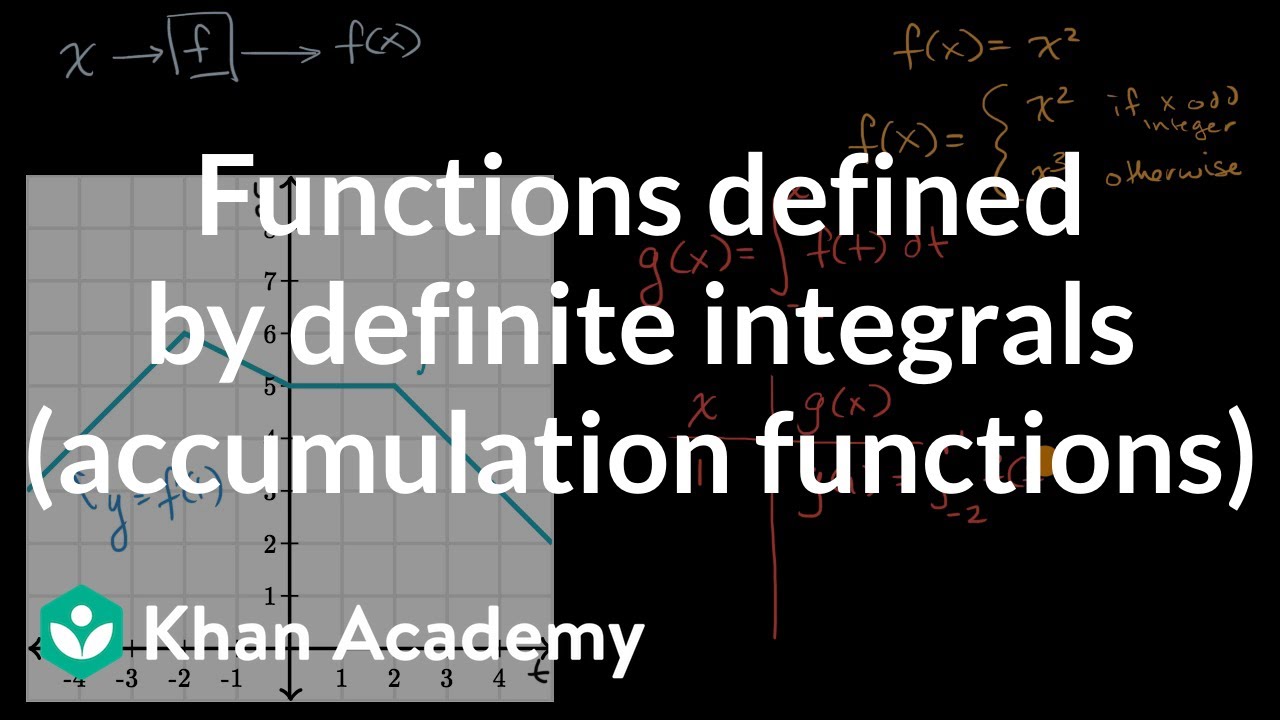
TLDRThe video script discusses the concept of definite integrals through a function g(t) and introduces a new function G(x) as the definite integral from -3 to x of g(t) dt. The video demonstrates evaluating G(4) and G(8) by calculating the areas under the curve of g(t) and above/below the t-axis, resulting in the same value of -3.5 for both, highlighting the properties of definite integrals and their geometric interpretation.
Takeaways
- 📌 The script introduces a function g(t) and defines a new function G(x) as the definite integral of g(t) from t=-3 to t=x.
- 📈 G(x) is evaluated at specific points, x=4 and x=8, using the graph of g(t) to find the areas under the curve and above the t-axis.
- 🔢 The evaluation of G(4) involves calculating the area of a triangle with base 3 and height 3, resulting in a value of 4.5, and a negative area of -8, leading to a final result of -3.5.
- 🔢 For G(8), the calculation includes additional areas and results in the same value as G(4), which is -3.5, demonstrating the subtraction and addition of equal areas.
- 📊 The process of evaluating G(x) involves breaking down the integral into parts corresponding to different intervals, each with its own area calculation.
- 🟫 The concept of negative area is introduced when the curve g(t) lies below the t-axis, which is taken into account when calculating the definite integral.
- 🤔 The video encourages viewers to pause and attempt the calculations independently before revealing the solution.
- 🧩 The area calculations involve basic geometric shapes like triangles, with the key being to determine whether the area contributes positively or negatively to the integral.
- 📌 The definite integral is used to find the accumulated quantity, in this case, the area under the curve of g(t) from one point to another.
- 🔄 The script highlights the symmetry in the calculation process when the same areas are subtracted and added, leading to consistent results.
- 📈 The graph of g(t) serves as a visual tool to understand the accumulation of areas and the concept of definite integrals in a more intuitive way.
Q & A
What is the function g(t) in the given context?
-The function g(t) is a time-based function for which a graph is provided in the script. It is used to define the new function capital G(x).
How is the function capital G(x) defined?
-Capital G(x) is defined as the definite integral of the function g(t) from t = -3 to t = x, which is represented as ∫ from -3 to x of g(t) dt.
What is the significance of the definite integral in defining capital G(x)?
-The definite integral in the definition of capital G(x) represents the area under the curve of g(t) between the interval [-3, x], which is used to evaluate the function at a specific point x.
How is the value of capital G(4) calculated in the script?
-Capital G(4) is calculated by finding the area under the curve of g(t) from t = -3 to t = 4 and then accounting for the signed areas (positive and negative) to get a final value of -3.5.
What are the two areas considered in the calculation of capital G(4)?
-The two areas considered are a positive area (above the t-axis and below the graph of g(t)) from t = -3 to t = 0, which is a triangle with a base of 3 and height of 3, and a negative area (below the t-axis and above the graph of g(t)) from t = 0 to t = 4, which is also a triangle but with a base of 4 and height of 4.
What is the value of capital G(8) and how is it derived?
-The value of capital G(8) is also -3.5. It is derived by considering the areas from t = -3 to t = 0, t = 0 to t = 6, and t = 6 to t = 8, and then summing the positive and negative areas to get the final result.
Why do the values of capital G(4) and capital G(8) end up being the same?
-The values are the same because when moving from capital G(4) to capital G(8), the area subtracted (from t = 0 to t = 4) and the area added (from t = 6 to t = 8) have the same magnitude but opposite signs, thus canceling each other out and resulting in the same value.
How does the concept of signed areas play a role in the evaluation of capital G(x)?
-Signed areas are crucial in the evaluation of capital G(x) because they account for the regions above and below the t-axis. Positive areas are above the t-axis and below the curve, while negative areas are below the t-axis and above the curve. These signed areas are then combined to find the net area, which gives the value of capital G(x).
What is the geometric interpretation of the integral in the context of the script?
-In the context of the script, the integral has a geometric interpretation as the area under the curve of g(t) between two points on the t-axis. This area can be positive or negative depending on whether the curve is above or below the t-axis.
How does the shape of the graph of g(t) affect the calculation of capital G(x)?
-The shape of the graph of g(t) directly affects the calculation of capital G(x) because the value is determined by the area under the curve between specified intervals. The graph's intersections with the t-axis and its overall position relative to the axis determine whether the areas are positive or negative and thus influence the final value of capital G(x).
What is the significance of the base and height of the triangles used in the calculations?
-The base and height of the triangles are significant because they determine the size of the areas used in the calculation of capital G(x). These areas are used to find the definite integral, and their magnitudes directly affect the final value of the function at a given x.
Outlines
📊 Introduction to Definite Integrals and Evaluating G(4)
This section introduces a new function, G(x), defined as the definite integral of another function g(t) from t = -3 to t = x. The speaker sets up a scenario to evaluate G(x) at x = 4 and x = 8, encouraging the audience to try solving on their own before proceeding with the explanation. The explanation for G(4) involves calculating the area under the curve of g(t) from t = -3 to t = 4. This calculation is split into two parts: the area from t = -3 to t = 0 (positive area) and from t = 0 to t = 4 (negative area). The positive area is determined to be 4.5 (from a triangle with base and height of 3), and the negative area is calculated as -8 (from a triangle with base and height of 4), leading to a net area of -3.5 for G(4).
🧮 Extending Calculations to Evaluate G(8)
In this paragraph, the process for evaluating G(8) is detailed, building upon the previous explanation for G(4). The calculation involves adding the areas under the curve from t = 0 to t = 6 (negative area) and from t = 6 to t = 8 (positive area) to the already established value from G(4). The area from t = 0 to t = 6 is calculated as a negative 12 (from a triangle with base of 6 and height of 4), and the area from t = 6 to t = 8 as a positive 4 (from a rectangle with dimensions 2x4), leading to a final result of -3.5 for G(8) as well. The similarity in the outcomes for G(4) and G(8) is attributed to the addition and subtraction of equivalent areas in the process, highlighting the geometric approach to understanding definite integrals.
Mindmap
Keywords
💡graph
💡definite integral
💡function
💡area
💡t-axis
💡capital G of x
💡evaluation
💡negative area
💡positive area
💡signed area
💡calculation
Highlights
The introduction of a new function, capital G of x, defined as the definite integral of g of t from t=-3 to t=x.
The evaluation of capital G at x=4, which involves calculating the area under the graph of g(t) from t=-3 to t=4.
The visual representation of the integral as the area above the t-axis and below the graph of g(t), but only for the section where the graph is above the t-axis.
The identification of the first area of integration as a triangle with base length 3 and height 3, resulting in an area calculation of 4.5.
The explanation of the yellow shaded area as a negative area because it is below the t-axis and above the graph of g(t).
The calculation of the value of capital G at x=4, which results in a value of -3.5 after accounting for the positive and negative areas.
The process of evaluating capital G at x=8, which involves considering additional areas under the graph of g(t) from t=0 to t=6 and from t=6 to t=8.
The calculation of the area for the interval from t=0 to t=6, which is a triangle with base 6 and height 4, resulting in a value of 12.
The explanation of the third area as a negative area, below the t-axis and above the graph, with a calculation resulting in -12.
The final area calculation for the interval from t=6 to t=8, which is a positive area with a value of 4.
The conclusion that capital G at x=8 also results in a value of -3.5, demonstrating the symmetry in the calculation process.
The explanation of why the values of capital G at x=4 and x=8 are the same, due to the subtraction and addition of areas of equal magnitude.
The use of visual aids, such as shading and circling, to clarify the process of calculating areas and their contributions to the integral.
The encouragement for viewers to pause the video and attempt the calculations independently, promoting active learning and engagement.
The detailed breakdown of the integral into multiple parts, each representing a different section under the graph of g(t), which simplifies the calculation process.
The clear and methodical approach to evaluating definite integrals, which serves as a valuable example for understanding the concept and application of integration.
Transcripts
Browse More Related Video
Functions defined by definite integrals (accumulation functions) | AP Calculus AB | Khan Academy
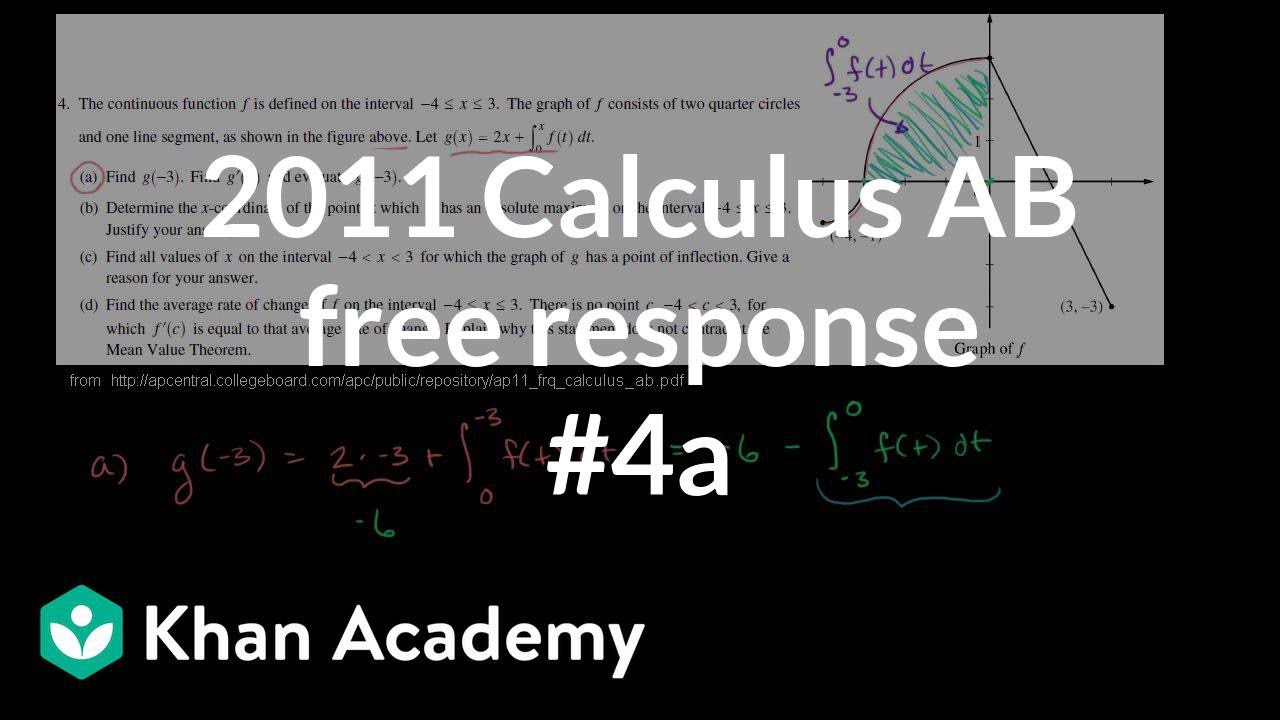
2011 Calculus AB free response #4a | AP Calculus AB | Khan Academy
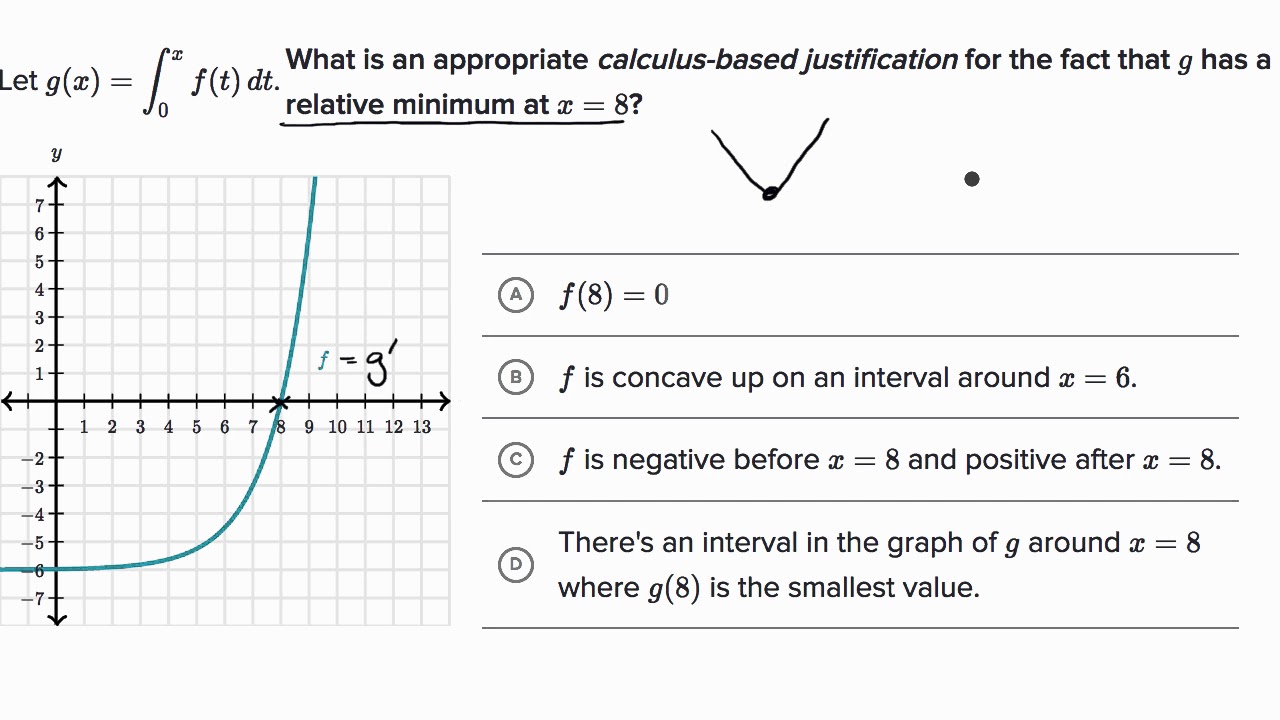
Interpreting behavior of _ from graph of _'=ÃÂ | AP Calculus AB | Khan Academy
2019 AP Calculus AB & BC Free Response Question #3
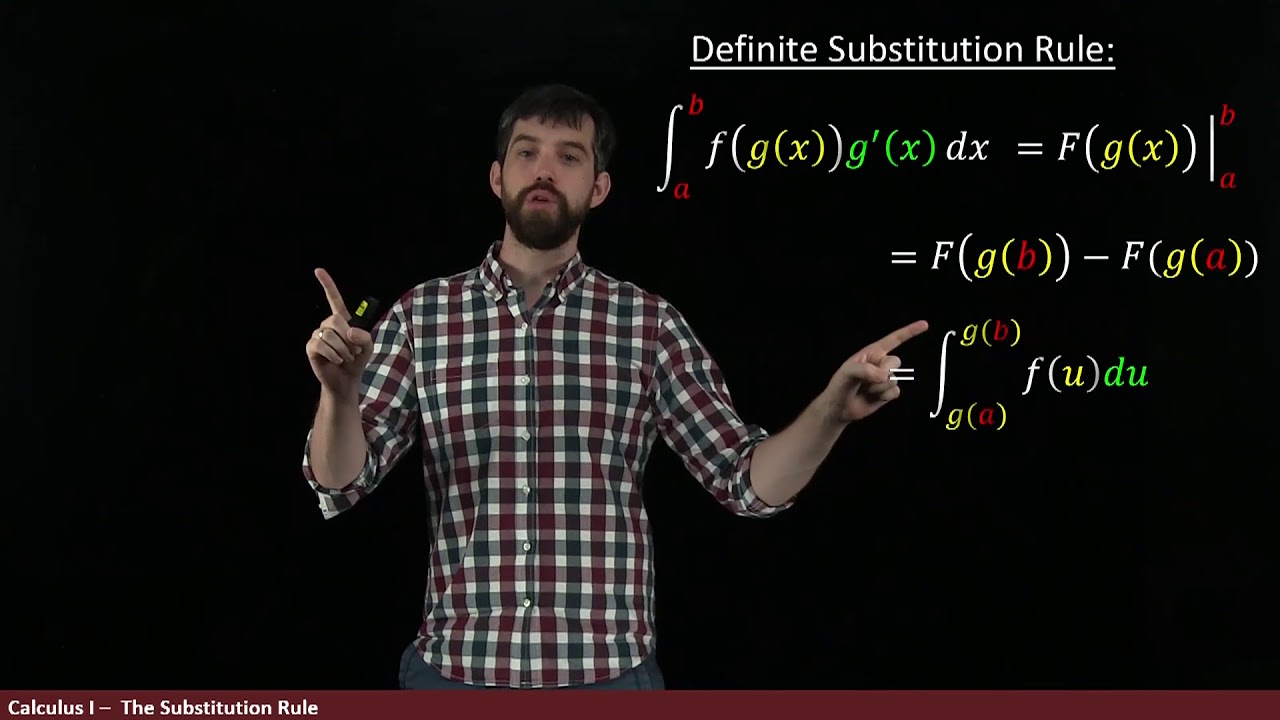
Substitution Method for Definite Integrals **careful!**
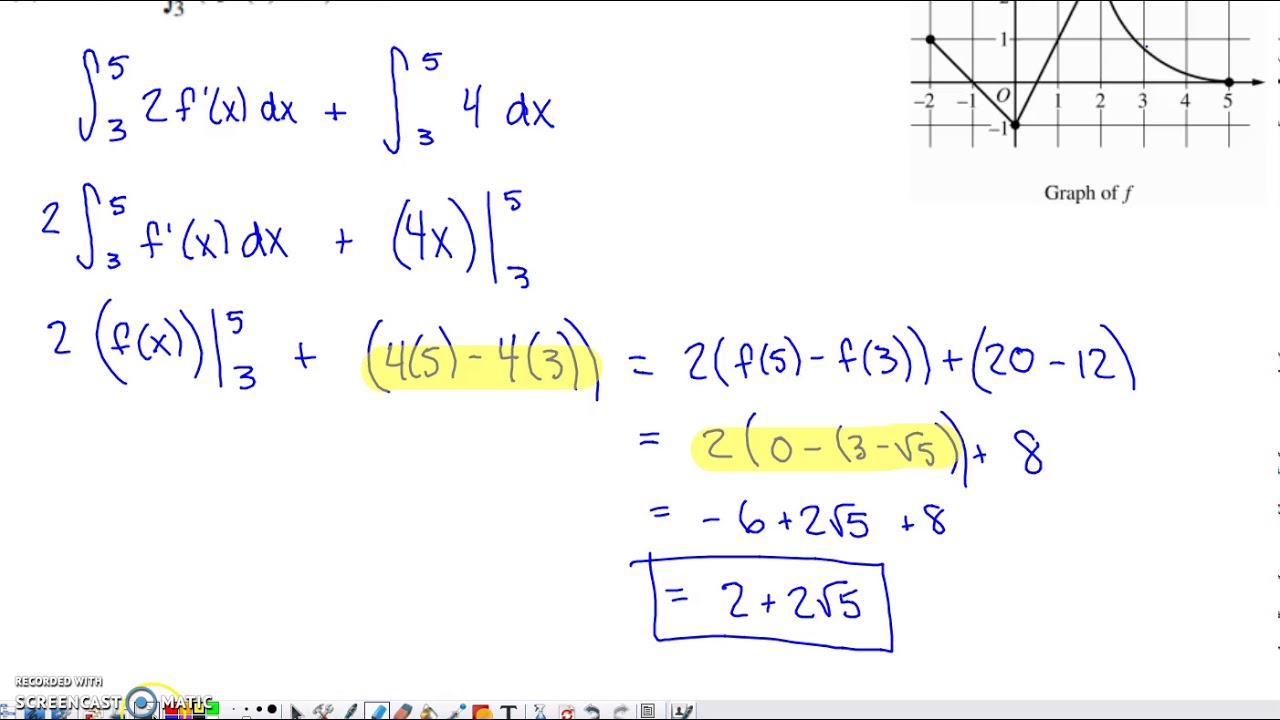
2006 AP Calculus AB Free Response #3
5.0 / 5 (0 votes)
Thanks for rating: