Over- and under-estimation of Riemann sums | AP Calculus AB | Khan Academy
TLDRThe video script discusses the concept of left and right Riemann sums as methods to approximate the area under a curve. It explains that for a strictly decreasing function over an interval, the left Riemann sum will overestimate the area, while the right Riemann sum will underestimate it. This is due to the heights used for the approximating rectangles being higher at the left edges and lower at the right edges of the subdivisions. The script also mentions that for strictly increasing functions, the roles would be reversed, and for other functions, the estimate could vary depending on the subdivision chosen.
Takeaways
- 📈 The left and right Riemann sums are methods to approximate the area under a curve.
- 🔍 For the left Riemann sum, the function is evaluated at the left endpoint of each subdivision.
- 📊 When approximating with the left Riemann sum, if the function is strictly decreasing, the result tends to be an overestimation.
- 📐 The right Riemann sum uses the right endpoint of each subdivision to determine the height of the approximating rectangles.
- 🔼 In the case of a strictly decreasing function, the right Riemann sum will generally lead to an underestimate of the area.
- 🔄 The choice of subdivisions can impact whether the approximation is an overestimation or an underestimate.
- 🔄 For a strictly increasing function, the roles of overestimation and underestimate switch between the left and right Riemann sums.
- 🤔 The accuracy of Riemann sums depends on the behavior of the function and the choice of subdivision points.
- 📊 Riemann sums provide a way to calculate areas when the function or the exact shape of the area is not easily defined.
- 🌟 Both left and right Riemann sums are valuable tools in numerical analysis for approximating integrals.
- 📈 Understanding the function's behavior is crucial for selecting the appropriate Riemann sum method for accurate approximations.
Q & A
What are the left and right Riemann sums used for in the context of the script?
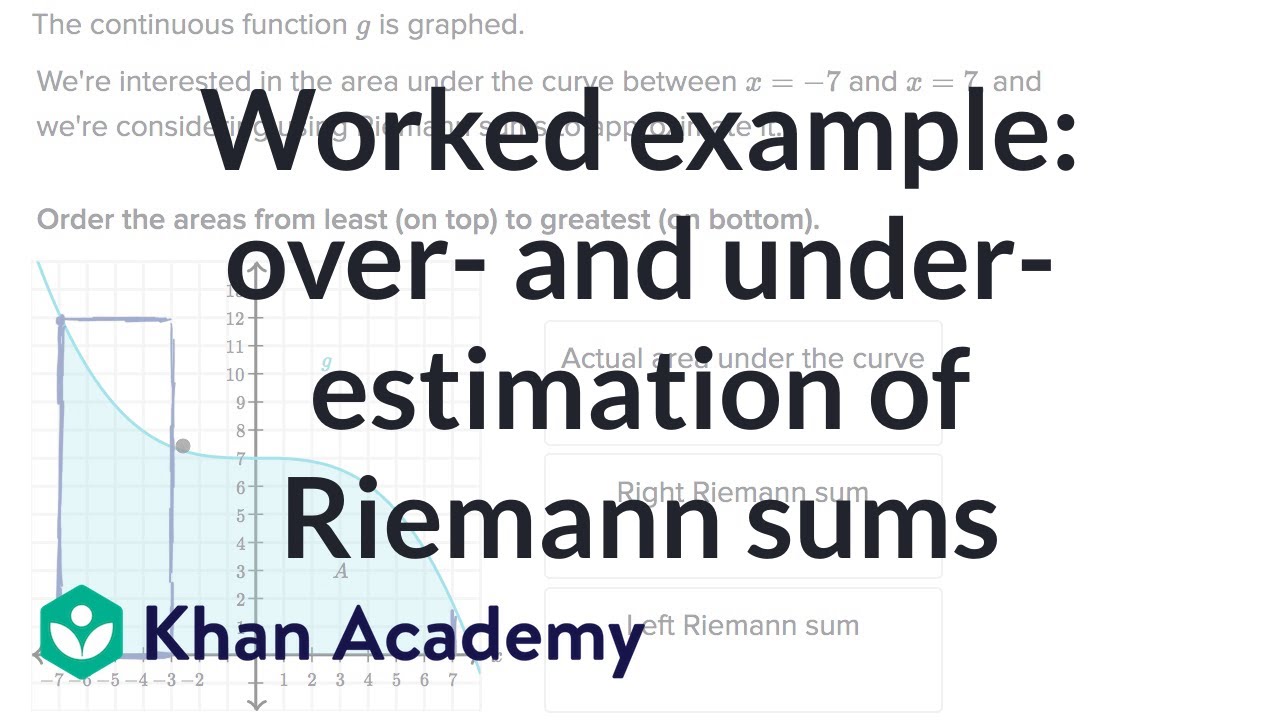
-The left and right Riemann sums are used to approximate the area under a curve, specifically y equals g(x), between x equals two and x equals eight in the script.
How many subdivisions were chosen for the approximation in the example given?
-In the example provided, three equal subdivisions were chosen for the approximation.
What is the interval for the first subdivision in the left Riemann sum?
-The interval for the first subdivision in the left Riemann sum is from x equals two to x equals four.
Which function values are used to determine the height of the approximating rectangles in the left Riemann sum?
-The function values at the left endpoint of each subdivision, g(x), are used to determine the height of the approximating rectangles in the left Riemann sum.
Why does the left Riemann sum result in an overestimation for a strictly decreasing function?
-The left Riemann sum results in an overestimation for a strictly decreasing function because the rectangles have surplus area and are always larger than the actual area they are trying to approximate.
How does the right Riemann sum differ from the left Riemann sum in terms of estimation?
-The right Riemann sum tends to be an underestimate as it captures less area than it is trying to approximate, especially when dealing with a strictly decreasing function.
What is the interval for the second subdivision in the right Riemann sum?
-The interval for the second subdivision in the right Riemann sum is from x equals four to x equals six.
Which function values are used to determine the height of the approximating rectangles in the right Riemann sum?
-The function values at the right endpoint of each subdivision, g(x), are used to determine the height of the approximating rectangles in the right Riemann sum.
Why does the right Riemann sum result in an underestimation for a strictly decreasing function?
-The right Riemann sum results in an underestimation for a strictly decreasing function because the right endpoint values of g(x) are the lowest within each subdivision, leading to a lower height for the approximating rectangles.
How do the Riemann sums change if the function is strictly increasing instead of decreasing?
-If the function is strictly increasing, the roles of the left and right Riemann sums are swapped, with the left sum tending to be an underestimate and the right sum tending to be an overestimate.
What can affect whether the Riemann sum is an overestimate or an underestimate for functions that are neither strictly increasing nor decreasing?
-For functions that are neither strictly increasing nor decreasing, the type of subdivisions chosen can affect whether the Riemann sum results in an overestimate or an underestimate.
Outlines
📊 Understanding Left and Right Riemann Sums
This paragraph discusses the concept of left and right Riemann sums and how they are used to approximate the area under a curve. It explains that the choice of subdivisions and the points on the curve used for estimation can lead to overestimations or underestimations. The narrator uses the function g(x) as an example and describes how a left Riemann sum overestimates the area when the function is strictly decreasing, as the rectangles constructed will have surplus area not part of the actual area of interest. Conversely, a right Riemann sum underestimates the area for the same reason, as the rectangles do not capture the entire area of interest. The paragraph emphasizes the impact of the function's behavior (increasing or decreasing) on the accuracy of these approximations.
Mindmap
Keywords
💡Riemann Sums
💡Approximation
💡Subdivisions
💡Left Riemann Sum
💡Right Riemann Sum
💡Decreasing Function
💡Overestimation
💡Underestimation
💡Area Under a Curve
💡Strictly Decreasing
💡Endpoints
Highlights
The discussion focuses on approximating the area under a curve using left and right Riemann sums.
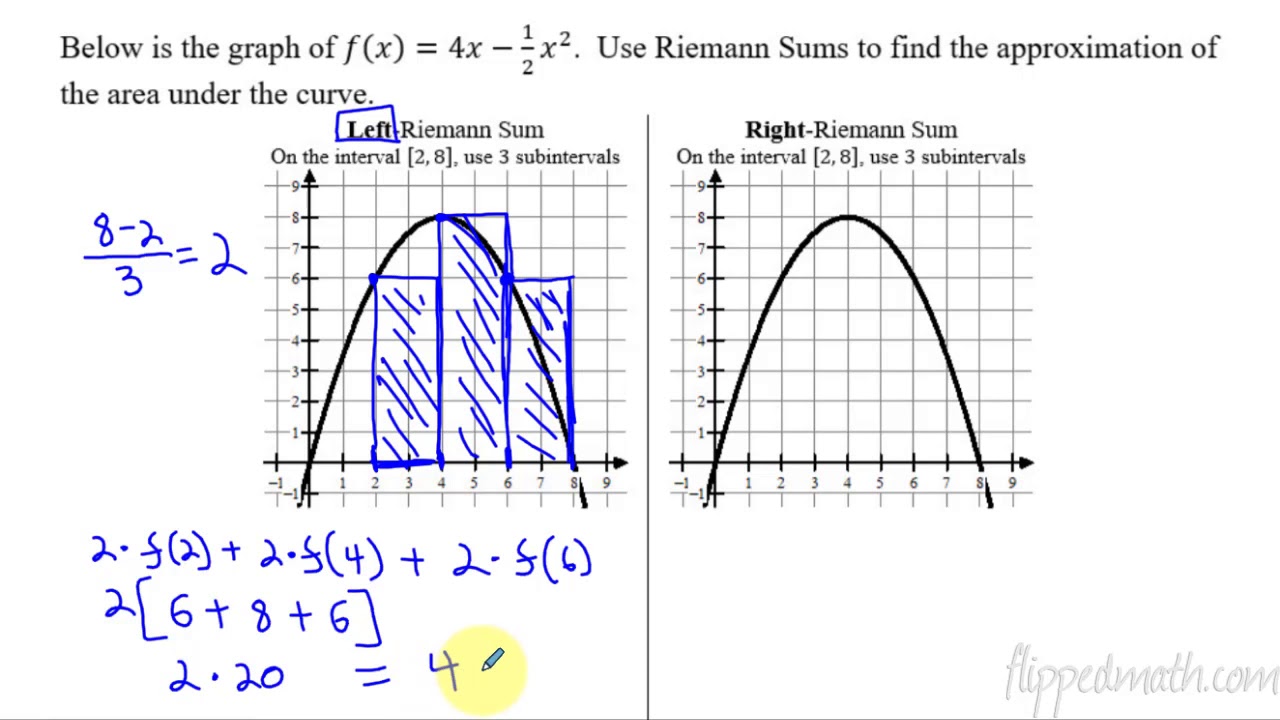
The left Riemann sum involves dividing the interval into equal subdivisions and using the left side of each to estimate the height of rectangles.
The right Riemann sum uses the right side of each subdivision to define the height of the rectangles for approximation.
For a strictly decreasing function over an interval, the left Riemann sum will overestimate the area.
The right Riemann sum will underestimate the area for the same function and interval as the left Riemann sum.
The left Riemann sum's overestimation is due to the surplus area of the rectangles used for approximation.
The right Riemann sum's underestimation is because it does not capture the entire area of the function's curve within the rectangles.
The value of the function at the left edge is higher than any point within the subdivision for a strictly decreasing function.
The right Riemann sum uses the lowest value of the function within a subdivision, leading to a lower height for the approximating rectangles.
For a strictly increasing function, the behaviors of the left and right Riemann sums would be reversed.
The type of subdivisions chosen can influence whether an approximation is an overestimate or an underestimate.
The transcript provides a clear visualization and explanation of the concepts of left and right Riemann sums.
The mathematical concepts are explained in a manner accessible to those who may not be deeply familiar with calculus.
The transcript serves as an educational resource for understanding Riemann sums and their applications in approximating areas under curves.
The transcript offers insights into the relationship between the behavior of a function and the accuracy of Riemann sum approximations.
The approximation process is contextualized with a practical example, enhancing the understanding of the theoretical concepts.
Transcripts
Browse More Related Video
Worked example: over- and under-estimation of Riemann sums | AP Calculus AB | Khan Academy
Left, Right, & Midpoint Riemann Sum Formulas
Calculus AB/BC – 6.2 Approximating Areas with Riemann Sums
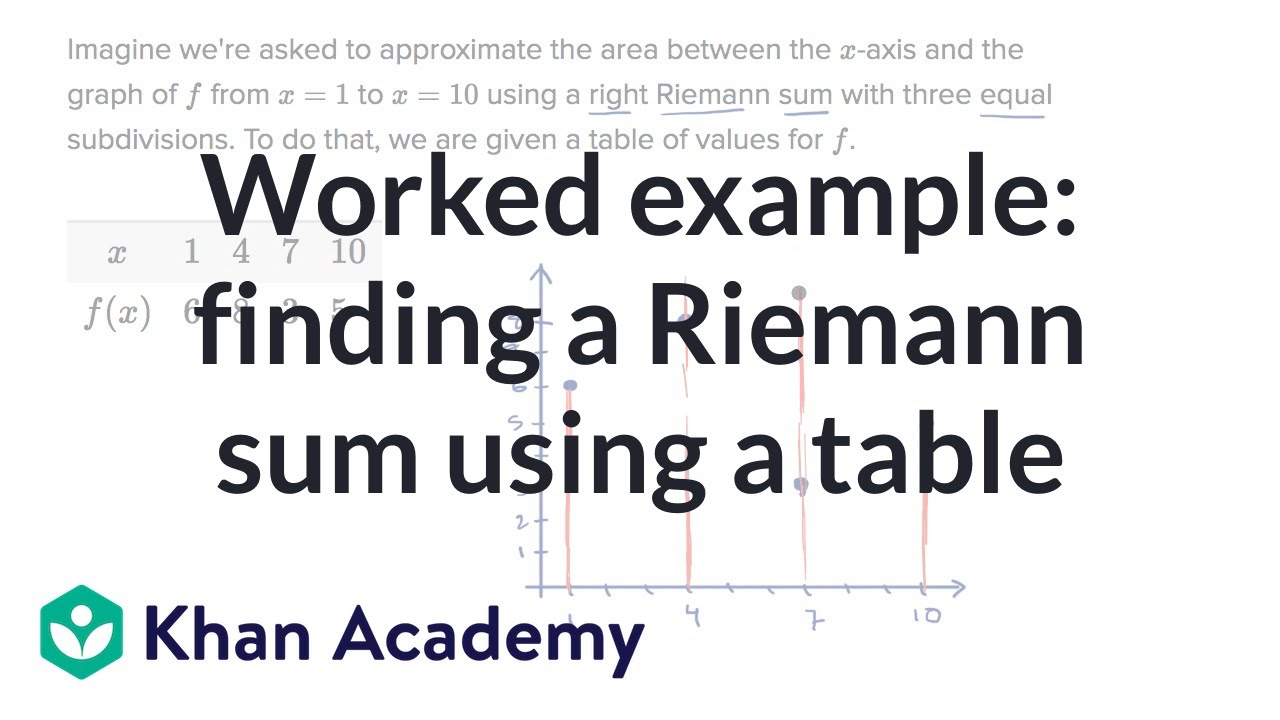
Worked example: finding a Riemann sum using a table | AP Calculus AB | Khan Academy

Business Calculus - Math 1329 - Section 5.3 - The Definite Integral and Fundamental Thm of Calculus

AP Calculus AB: Lesson 6.2 Riemann and Trapezoidal Sums
5.0 / 5 (0 votes)
Thanks for rating: