What is a p-value? by Daniel Lakens
TLDRThis lecture clarifies the concept and interpretation of p-values in statistical analysis. It explains that p-values measure the surprise of the data given a null hypothesis and are not a measure of the hypothesis's truth. Misinterpretations are common, but understanding p-values as a long-term guide for decision-making, rather than a definitive statement about an effect, is crucial. The lecture also touches on Bayesian statistics as an alternative approach for making probabilistic statements about theories.
Takeaways
- 💭 P-values offer a first line of defense against being fooled by randomness, helping to separate signal from noise in scientific data.
- 💡 Misinterpretation of p-values is common, and understanding their correct meaning is crucial for scientific research.
- 🧐 Bayesian statistics do not rely on p-values, presenting an alternative approach for those questioning the use of p-values.
- 📈 P-values indicate how surprising data is under the assumption that there is no effect, rather than proving a hypothesis directly.
- 👀 A common misunderstanding is to interpret p-values as the probability of a theory being true, which is incorrect.
- 🚨 When a p-value is smaller than 0.05, it suggests the data is surprising enough to merit further investigation but does not confirm a theory.
- 🤔 Larger than 0.05 p-values indicate data is not surprising, which could mean a true effect was not detected due to sample size limitations.
- 📌 Using p-values correctly involves acting on the data in a way that limits false discoveries over the long run.
- 🔍 P-value distributions vary: with a true effect, smaller p-values are more likely; without an effect, p-values are uniformly distributed.
- 🏆 Repeated experiments and considering effect sizes alongside p-values are necessary for robust scientific conclusions.
Q & A
What is the primary purpose of p-values in scientific research?
-The primary purpose of p-values is to serve as a statistical measure that helps differentiate between random variation (noise) and a true effect (signal) in data, offering a first line of defense against being fooled by randomness.
Why are p-values widely criticized?
-P-values are widely criticized because they are often misinterpreted. People may mistakenly use them to make statements about the probability of a theory being true, rather than the probability of observing the data given the null hypothesis.
What is the formal definition of a p-value?
-The formal definition of a p-value is the probability of obtaining the observed data or more extreme data, assuming the null hypothesis is true.
How can p-values be used correctly in the context of statistical analysis?
-P-values can be used correctly by understanding them as a guide for behavior in the long run, using them in conjunction with other statistical measures like effect sizes, and by recognizing that they are not definitive proof of a hypothesis but rather an indication of how surprising the data is under the null hypothesis.
What is the relationship between p-values and Bayesian statistics?
-P-values are not used in Bayesian statistics, which instead focuses on calculating the probability of a hypothesis given the observed data. Bayesian statistics provide a different approach to statistical inference that can be preferable for some researchers, but p-values remain a common tool in many scientific fields.
What does a p-value less than 0.05 typically indicate in the context of statistical significance?
-A p-value less than 0.05 typically indicates that the observed data is statistically significant, meaning it is unlikely to have occurred by chance alone, assuming the null hypothesis is true. This suggests that there may be a true effect or difference worth further investigation.
How should one interpret a p-value that is greater than 0.05?
-A p-value greater than 0.05 suggests that the observed data is not surprising under the null hypothesis, and therefore, it does not provide strong evidence for a true effect. However, it does not necessarily mean that there is no effect; it could be that the effect is small or the sample size is not large enough to detect it.
What is the concept of 'insert mu' in Zen Buddhism, and how does it relate to interpreting p-values greater than 0.05?
-In Zen Buddhism, 'insert mu' is a concept where a question is negated when asked. It relates to interpreting p-values greater than 0.05 because, just as the Zen master negates the question with 'mu', we should not conclude the absence of an effect when we observe a non-significant p-value. Instead, we acknowledge the data's lack of statistical significance and remain open to further investigation.
What does a uniform distribution of p-values indicate in the absence of a true effect?
-A uniform distribution of p-values in the absence of a true effect indicates that every p-value, regardless of its magnitude, is equally likely. This means that there is a 5% chance of obtaining a p-value less than 0.05 purely by chance, leading to a type 1 error.
How does statistical power affect the distribution of p-values?
-Statistical power affects the distribution of p-values by influencing the likelihood of observing small p-values. Higher statistical power, which indicates a greater probability of detecting a true effect, results in a distribution where more p-values fall below the significance level of 0.05.
What is the significance of the 5 Sigma threshold in physics?
-The 5 Sigma threshold in physics is used as a high standard for declaring a discovery. It corresponds to a p-value smaller than 0.0000003, indicating that there is only a 0.003% chance that the observed effect is due to random variation. This high threshold provides a strong level of confidence in the discovery.
Why is it important to consider multiple studies and not rely solely on p-values when evaluating a scientific hypothesis?
-It is important to consider multiple studies because a single p-value can be influenced by random variation, and no single experiment can provide definitive proof of a phenomenon. Multiple studies, including replications, can provide stronger evidence and help to confirm the presence of a true effect, leading to a more robust scientific conclusion.
Outlines
🔍 Understanding P-Values in Research
This segment explains the significance and common misinterpretations of p-values in scientific research. P-values serve as a statistical tool to distinguish signal from noise, helping researchers avoid being misled by randomness in their data. Despite their widespread use, p-values are often misunderstood as statements about the probability of a hypothesis being true, rather than what they actually are: measures of how surprising the data is under the assumption that there is no effect. The narrative stresses the importance of correct interpretation and introduces Bayesian statistics as an alternative approach that does not rely on p-values. Through a practical example involving a study on phone use while driving, the concept of p-values is further elucidated, emphasizing that they indicate the likelihood of observing the given data if there was no real effect, rather than confirming the presence of an effect.
📊 Interpreting P-Values and Statistical Significance
This part delves deeper into the interpretation of p-values, especially in terms of statistical significance and the common threshold of 0.05 (or 5% significance level). It clarifies that p-values less than 0.05 indicate data that is surprising enough to warrant further investigation under the null hypothesis of no effect. The narrative explains the formal definition of a p-value as the probability of observing data as extreme as, or more extreme than, what was actually observed, assuming the null hypothesis is true. It also addresses a common misconception that a p-value reflects the probability of a theory being true, using an example from quantum physics to highlight how even experts can misinterpret p-values. The section concludes with a discussion on how to properly report and interpret p-values in research findings, emphasizing statements about the data rather than the theory being tested.
🤔 When P-Values Exceed the Significance Threshold
This section explores scenarios where p-values are greater than 0.05, suggesting that the observed data is not statistically surprising under the null hypothesis. It introduces the concept of 'mu' from Zen Buddhism as a metaphor for the indeterminate nature of such findings, emphasizing that a high p-value does not necessarily imply the absence of an effect, but rather that the data does not strongly support one. The segment underscores the importance of using p-values as a guide for long-term research behavior rather than definitive proof, explaining how they should inform researchers' actions and interpretations over time. It also touches on the emotional aspect of research when findings do not reach statistical significance, encouraging persistence and reconsideration of study design or effect size expectations.
🚀 Navigating Research with P-Values
This concluding part offers guidance on how to navigate the research process using p-values, advocating for a nuanced and informed approach. It stresses the importance of discretion in interpreting statistical tests and the need to consider p-values in the context of broader research findings, including effect sizes and replicability. The narrative revisits the advice of statisticians like Neyman, Pearson, and Fisher on the role of p-values in research, highlighting that no single p-value should be taken as conclusive evidence of an effect but rather as an indicator for further exploration. The section also illustrates how p-values are distributed across studies with true effects versus no effect, emphasizing the uniform distribution of p-values under the null hypothesis and how this influences the interpretation of statistical significance and type I error rates.
Mindmap
Keywords
💡p-values
💡statistical tests
💡null hypothesis
💡Bayesian statistics
💡Type 1 error
💡statistical power
💡effect size
💡meta-analysis
💡Zen Buddhism
💡Higgs boson
💡degenerative research line
Highlights
P-values offer a first line of defense against being fooled by randomness, helping to separate signal from noise in data interpretation.
Misinterpretation of P-values is common, underscoring the importance of understanding their correct usage in scientific research.
P-values measure how surprising data is under the assumption of no effect, aiding in the evaluation of hypothesis validity.
Bayesian statistics offer an alternative to P-values, providing direct probabilities of theories rather than just data.
Using a practical example, the importance of designing studies to accurately measure effects, such as the impact of calling while driving on accident risk, is highlighted.
The significance of observed data differences and the role of P-values in distinguishing between random noise and real differences.
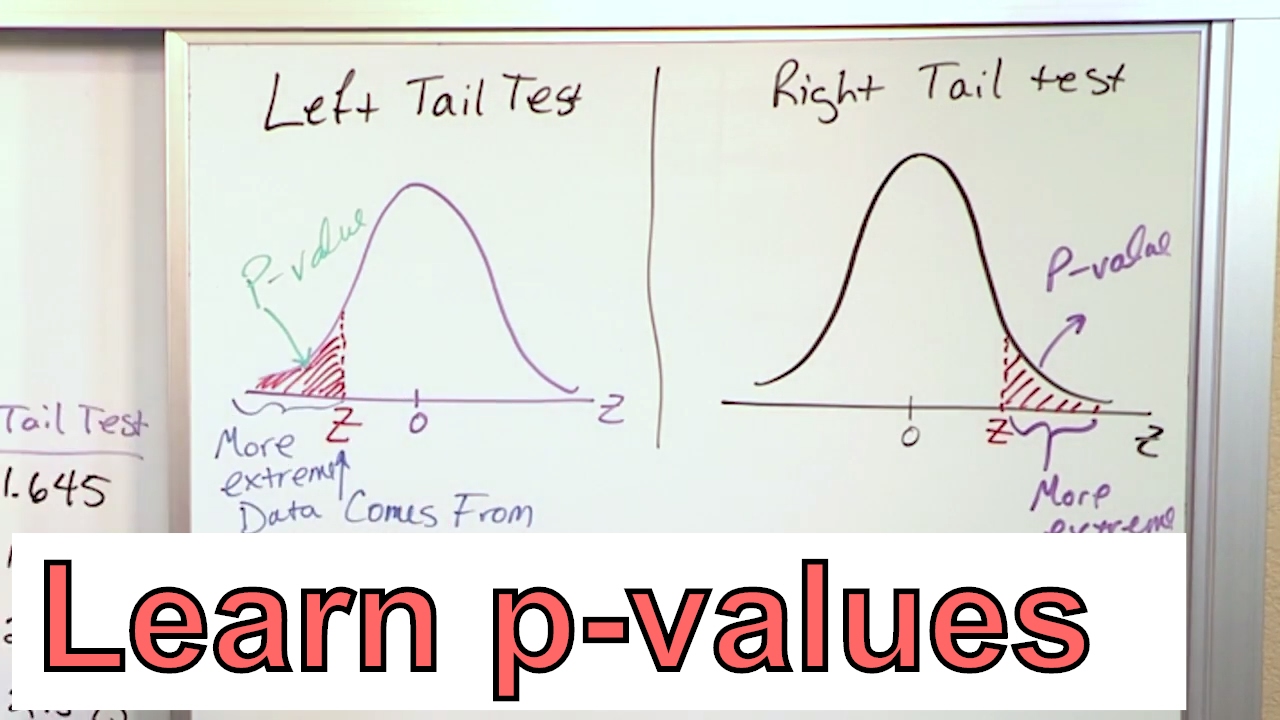
Critical values in P-value interpretation and the concept of data falling within or beyond expected ranges under the null hypothesis.
Formal definition of P-values as the probability of observing the current or more extreme data, assuming the null hypothesis is true.
Common misinterpretations of P-values, including confusing them with the probability of a theory being true, are clarified.
The misuse of P-values in quantum physics research highlights the widespread nature of misinterpretation across scientific disciplines.
The limited implication of non-significant P-values, which cannot conclusively prove the absence of an effect.
The concept of 'mu' from Zen Buddhism is used as an analogy for the indeterminate nature of results when P-values are larger than 0.05.
The role of P-values as a behavioral guide in scientific research, emphasizing their utility in the long run rather than in individual studies.
The use of stringent P-value thresholds in physics, such as the 5 Sigma rule for the discovery of the Higgs boson, illustrates discipline-specific standards.
The importance of considering effect sizes, additional studies, and the broader research context when interpreting P-values.
The distribution of P-values in studies with true effects versus those with no effects, highlighting the variability and interpretation challenges.
Transcripts
Browse More Related Video

What is a p-value?
Calculate the P-Value in Statistics - Formula to Find the P-Value in Hypothesis Testing

p-values: What they are and how to interpret them

05 - Using P-Values in Hypothesis Testing (Compare P Value to Level of Significance)
How to calculate p-values
What does P-Value mean in Regression?
5.0 / 5 (0 votes)
Thanks for rating: