Ch. 2.6 Transformations of Functions
TLDRThis video script from a precalculus course delves into the concept of function transformations, a pivotal topic in understanding calculus. It covers vertical and horizontal translations, reflections, compressions, and expansions, emphasizing their impact on function graphs. The instructor illustrates how to apply these transformations step-by-step, using both algebraic expressions and graphical representations, to enhance students' ability to visualize and manipulate functions effectively.
Takeaways
- 📚 The lesson covers transformations of functions, which is a new topic for most students and crucial for understanding calculus.
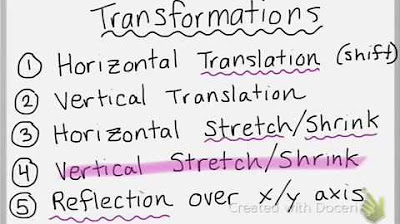
- 📈 Transformations can be vertical or horizontal translations, reflections, or compressions/expansions, altering the position, shape, or size of a function's graph.
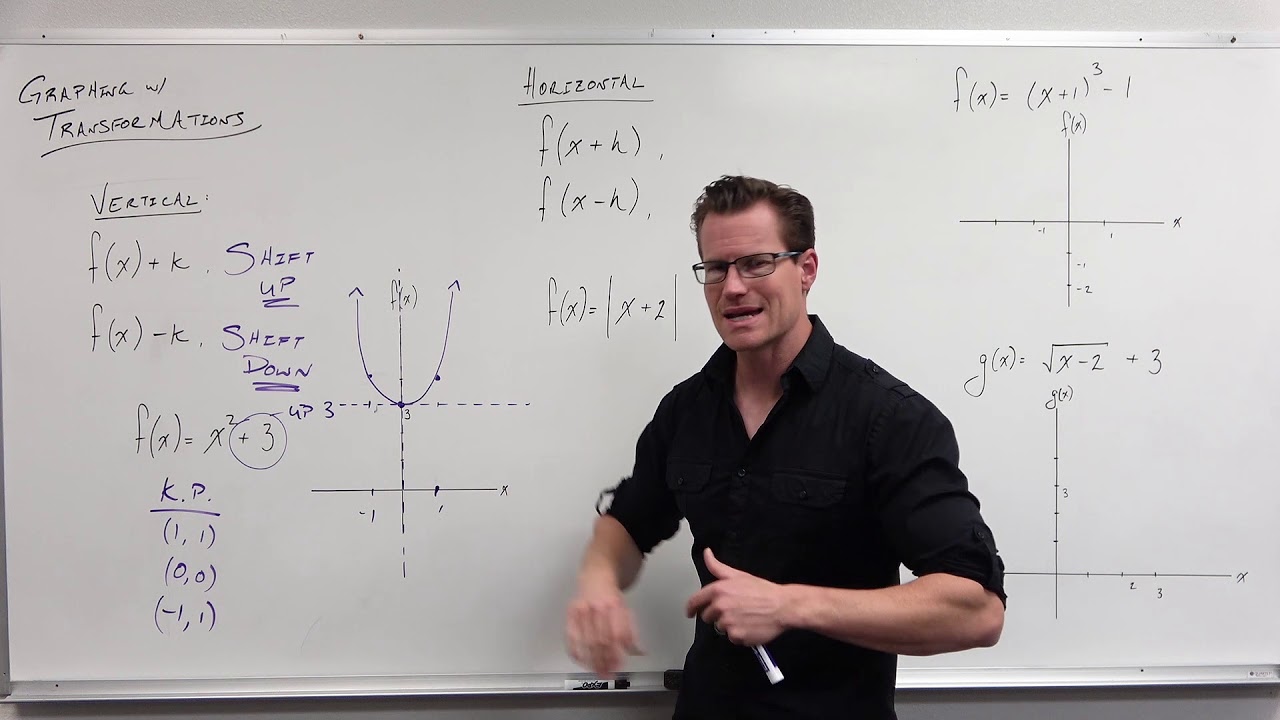
- 🔄 Vertical translation shifts a function up or down without changing its shape, achieved by adding or subtracting a constant (k) to the function.
- 🔄 Horizontal translation moves a function left or right, also without changing its shape, by subtracting a constant (h) from the input value of the function.
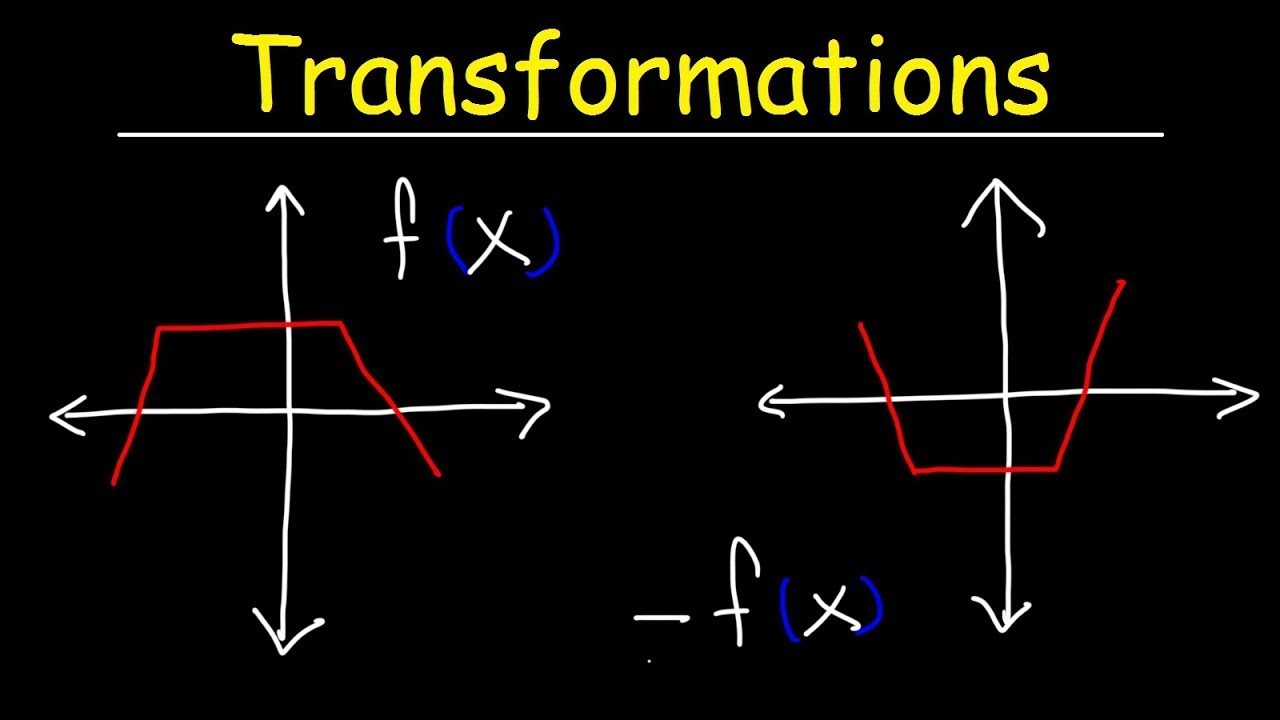
- 🔀 Reflections change the sign of the function's output values, flipping the graph across the x-axis or y-axis depending on the transformation applied.
- 🌐 Vertical compression and expansion (amplitude) adjust the height of the function's graph by multiplying the function by a constant, affecting the output values.
- 🌐 Horizontal compression and expansion inversely affect the width of the function's graph, with larger constants compressing the graph and smaller ones expanding it.
- 🔢 The order of transformations matters and is applied in the same sequence as the order of operations for x in the function's expression.
- 📉 The combination of multiple transformations results in new functions that are still transformations of basic functions from the library of functions.
- 📝 When applying transformations to a table of values, it's essential to perform them one at a time, following the order they would affect x in the function.
- 📊 Graphing transformations involves plotting the graph multiple times, applying one transformation at a time in the correct order, to achieve the final transformed graph.
Q & A
What is the main topic of Chapter 2.6 in the provided transcript?
-The main topic of Chapter 2.6 is transformations of functions, which includes vertical and horizontal translations, reflections, and compressions or expansions of functions.
Why are transformations of functions important in precalculus?
-Transformations of functions are important in precalculus because they provide a deeper understanding of algebra and trigonometry, and they are crucial for visualizing and understanding functions in calculus.
What is the effect of a vertical translation on the graph of a function?
-A vertical translation moves the graph of a function up or down without changing its shape. If k is positive, the graph shifts upwards, and if k is negative, it shifts downwards.
How does a horizontal translation differ from a vertical translation?
-A horizontal translation moves the graph of a function left or right, while a vertical translation moves it up or down. Horizontal translations involve adding or subtracting a constant from the input value (inside the function), whereas vertical translations involve adding or subtracting a constant to the output value (outside the function).
What happens to a function when it is reflected across the x-axis?
-When a function is reflected across the x-axis, all of its positive y-values become negative, and all of its negative y-values become positive. This is achieved by taking the negative of the original function.
What is the effect of vertical compression or expansion on a function's graph?
-Vertical compression or expansion changes the amplitude of the function's graph. If a constant is greater than 1, the graph expands, and if it is between 0 and 1, the graph compresses. A negative constant would both compress and reflect the graph across the x-axis.
How does horizontal compression or expansion work, and how does it differ from vertical transformations?
-Horizontal compression or expansion multiplies the input value by a constant (inside the function), which can either compress or stretch the graph horizontally. It differs from vertical transformations in that it affects the x-values rather than the y-values and works in an opposite manner to outside transformations.
Can transformations be applied in any order, or does the sequence matter?
-The order in which transformations are applied matters because it affects the final graph and outputs of the function. Transformations should be applied in the same order as the operations would be performed on x within the function.
What is an example of a combined transformation, and how would you apply it to a function?
-An example of a combined transformation is 'h(x) = 1/2 * sqrt(2) * (x + 3) - 4', which is a transformation of 'f(x) = sqrt(x)'. To apply it, you would first translate the graph left by 3 units, then compress it horizontally by a factor of 2, compress it vertically by 1/2, and finally translate it down by 4 units.
How can you determine the new function values from a table of values using the given transformations?
-You can determine the new function values by applying the transformations one at a time to each value in the table, following the order of operations. For example, if the transformation is '3 times f(x) - 2 + 1', you would first translate the x-values right by 2 units, then multiply the y-values by 3, and finally add 1 to each result.
What is the graphical representation of applying a negative two times transformation to a function?
-Applying a negative two times transformation graphically involves doubling the length of the graph, flipping it across both the x and y axes, and then translating the graph down by three units if the transformation ends with subtracting three.
Outlines
📚 Introduction to Function Transformations
The instructor begins by welcoming the class to Chapter 2.6, which focuses on the transformations of functions. This section is a crucial part of the precalculus curriculum, where students are introduced to new concepts alongside a deeper review of algebra and trigonometry. The main theme is the standard transformations of functions, a topic unfamiliar to most students. The instructor emphasizes the importance of understanding these transformations for ease in visualizing and comprehending functions in calculus. Vertical translations, which involve shifting functions up or down without altering their shape, are introduced as the first type of transformation, achieved by adding a constant 'k' to the function.
🔄 Horizontal and Reflective Transformations
The second paragraph delves into horizontal translations and reflections of functions. Horizontal translations involve moving the graph left or right without changing its shape, achieved by subtracting a constant 'h' from the input value, which is an 'inside shift'. The instructor clarifies that the direction of movement is counterintuitive to the sign of 'h'. Reflections are discussed next, where the instructor explains that negating the function results in a flip across the x-axis, changing the sign of all output values. Additionally, the instructor touches on vertical compression and expansion, which alter the amplitude of the function by multiplying the original function by a constant 'a'.
🔍 Combining Transformations and Their Order
In this paragraph, the instructor discusses the concept of combining multiple transformations on a single function and the importance of the order in which these transformations are applied. The order of transformations is likened to the order of operations in mathematics. An example is given where a function is transformed through a series of steps: horizontal compression, horizontal translation, vertical compression, and vertical translation. The instructor illustrates that changing the order of these operations results in a different graph, emphasizing the significance of the sequence in which transformations are applied.
📈 Applying Transformations to a Table of Values
The fourth paragraph presents a practical approach to applying transformations using a table of values for an unknown function 'f(x)'. The instructor demonstrates how to sequentially apply a series of transformations, including horizontal translation to the right, horizontal compression, and vertical translation downward, to the given values. The process involves adjusting the input and output values step by step, with the instructor highlighting the importance of understanding the order of operations in transforming the function.
🤔 Dealing with Unknown Functions and Transformations
The instructor addresses the scenario of applying transformations to an unknown function, emphasizing that the type of function does not affect the process of applying transformations. The focus is on the operations that occur to 'x' in the function's expression. An example is provided where the instructor shows how to apply a series of transformations to a set of values, even without knowing the explicit form of the function. The transformations include horizontal translation, compression, and vertical adjustments, demonstrating that the process is consistent regardless of the function's nature.
📊 Graphing Transformations Step by Step
The final paragraph of the script focuses on graphing transformations, both algebraically and through plotting. The instructor provides a step-by-step guide on how to apply a series of transformations to a graph, including horizontal compression, reflection across the y-axis, horizontal translation, and vertical reflection across the x-axis, followed by a downward vertical translation. The importance of applying transformations in the correct order is reiterated, and the paragraph concludes with a summary of the process for graphing transformed functions.
Mindmap
Keywords
💡Transformations of Functions
💡Vertical Translation
💡Horizontal Translation
💡Reflection
💡Compression and Expansion
💡Amplitude
💡Order of Operations
💡Inside Shift
💡Outside Shift
💡Table of Values
Highlights
Introduction to transformations of functions as a new topic for students.
Importance of understanding transformations for a deeper grasp of calculus.
Explanation of how transformations can alter the position, shape, and size of a function's graph.
Vertical translation of a function by adding a constant k, affecting only the position, not the shape.
Horizontal translation involves shifting the graph left or right without changing its shape.
Reflections across the x-axis and y-axis change the sign of function values and orientation.
Vertical compression and expansion change the amplitude of the function by multiplying by a constant.
Horizontal compression and expansion are achieved by multiplying the input inside the function.
Combining multiple transformations on a single function and the significance of the order of operations.
Practical application of transformations through a table of values for an unknown function.
Graphical representation of transformations step by step, emphasizing the process of visualizing changes.
The impact of inside and outside shifts on function transformations and their intuitive understanding.
Differentiating between the effects of positive and negative values in vertical and horizontal translations.
Clarification on the counter-intuitive nature of inside transformations for horizontal shifts.
The concept of amplitude in relation to vertical compression and expansion, and its effect on function graphs.
Using the order of operations to determine the sequence of applying multiple transformations to a function.
Visual demonstration of applying a series of transformations to a function graph, including flips and compressions.
The final graph resulting from a sequence of transformations, illustrating the process's complexity and outcome.
Transcripts
Browse More Related Video
Transformations of Functions | Precalculus
Introduction to Transformations of Functions

Graphing Rational Functions with Transformations (Precalculus - College Algebra 39)
Graphing Transformations with Sine and Cosine (Precalculus - Trigonometry 12)
Family of Functions
Introduction to Graph Transformations (Precalculus - College Algebra 14)
5.0 / 5 (0 votes)
Thanks for rating: