2 | FRQ (Part A: Probability) | Practice Sessions | AP Statistics
TLDRIn this AP Stats tutorial, Luke Wilcox explores probability through two free response questions. The first involves a shampoo filling machine with a normal distribution, calculating the probability of under-filled bottles and the likelihood of crate rejection due to under-filled shampoo bottles. The second question examines the performance of a new igniter for model rockets, assessing the success rate and failure probability over multiple tests. Wilcox's session concludes with a discussion on statistical evidence suggesting a lower failure rate for the new igniter, providing a comprehensive review of probability concepts.
Takeaways
- 📚 The video is an AP Stats practice session led by Luke Wilcox, an AP Stats teacher at East Kentwood High School in Michigan.
- 📝 Students are encouraged to download and attempt the probability questions before watching the video for self-assessment.
- 🧴 The first problem involves a shampoo filling machine with a normal distribution of shampoo amounts, aiming to find the probability of underfilling.
- 📉 The normal distribution of shampoo amounts is characterized by a mean of 0.6 liters and a standard deviation of 0.04 liters.
- 🔢 The z-score calculation for the underfilling threshold (0.5 liters) results in -2.5, indicating 2.5 standard deviations below the mean.
- 📊 Using the z-table, the probability of a bottle being underfilled is approximately 0.0062 or 0.062.
- 📦 The second scenario involves shipping crates of shampoo bottles, where crates may be rejected if a random box contains two or more underfilled bottles.
- 🎯 The probability of crate rejection is calculated using the binomial distribution, considering the independence of bottle fillings.
- 📈 Adjusting the machine's programming to a mean of 0.56 liters and a standard deviation of 0.03 actually increases the underfill probability to 0.02275, not improving the situation.
- 🚀 The second question discusses the testing of a new 'super igniter' for model rockets with a given 15% failure rate.
- 🔄 The testing process for super igniters involves launching rockets sequentially until a failure occurs or 32 successful launches happen.
- 🤔 Given the success of the first 30 super igniters, a statistical analysis suggests that it may be reasonable to believe the failure rate is less than 15% based on a very low p-value.
Q & A
Who is the speaker in the video session?
-The speaker is Luke Wilcox, an AP Stats teacher at East Kentwood High School in Kentwood, Michigan.
What is the main topic of the video session?
-The main topic of the video session is to go through two free response questions related to probability.
What is the recommendation for students before watching the video?
-The recommendation is for students to download the questions first and try them on their own before watching the video.
What is the normal distribution of the shampoo amount in the bottles according to the script?
-The shampoo amount in the bottles is normally distributed with a mean of 0.6 liters and a standard deviation of 0.04 liters.
What is considered as an under filled bottle in the script?
-A bottle is considered to be under filled if it has less than 0.5 liter of shampoo.
What is the calculated probability that a randomly selected bottle of shampoo will be under filled?
-The calculated probability that a randomly selected bottle of shampoo will be under filled is about 0.062 or 6.2%.
What is the distribution of the random variable X, which represents the number of under filled bottles in a box of 10 bottles?
-The random variable X is distributed as a binomial random variable with a fixed number of trials n equal to 10 and the probability of each bottle being under filled is 0.062.
What is the condition for a crate to be rejected by the beauty supply warehouse manager?
-A crate will be rejected if two or more bottles in the randomly selected box are under filled.
What is the calculated probability that a crate will be rejected by the warehouse manager?
-The calculated probability that a crate will be rejected by the warehouse manager is 0.0017 or 0.17%.
What is the company considering to reduce the number of crates rejected by the beauty supply warehouse manager?
-The company is considering adjusting the program of the filling machine so that the amount of shampoo in each bottle is normally distributed with a mean of 0.56 and a standard deviation of 0.03.
What is the recommendation for the manufacturing company regarding the original vs. adjusted programming of the filling machine?
-The recommendation is to continue using the original programming of the filling machine because the probability of an under filled bottle is lower with the original programming (0.062) compared to the adjusted programming (0.02275).
What is the failure rate of the igniters in the company's model rockets?
-The company estimates that the overall failure rate of the igniters is 15%.
What is the significance of the testing process for the super igniters?
-The testing process is to determine the performance of the super igniters by launching rockets with them until a failure occurs or 32 successful launches have been achieved.
What is the probability that the first 30 super igniters selected using the testing process successfully launch rockets?
-The probability that the first 30 super igniters successfully launch rockets is 0.0076 or 0.76%.
Given that the first 30 super igniters successfully launch rockets, what is the probability that the first failure occurs on the 31st or 32nd super igniter tested?
-The probability that the first failure occurs on the 31st or 32nd super igniter tested, given that the first 30 were successful, is 0.2775 or 27.75%.
Is it reasonable to believe that the failure rate of the super igniters is less than 15% given the first 30 successfully launched rockets?
-Yes, it is reasonable to believe that the failure rate is less than 15% because the probability of 30 consecutive successful launches with a 15% failure rate is very low (0.0076), which is strong evidence against the null hypothesis of a 15% failure rate.
Outlines
📚 AP Statistics Practice Session Introduction
Luke Wilcox, an AP Stats teacher at East Kentwood High School, introduces an AP Daily practice session focused on probability. He encourages students to download and attempt two free response questions before watching the video. The first question involves a machine that fills shampoo bottles with a normal distribution of mean 0.6 liters and standard deviation 0.04 liters. The task is to determine the probability of underfilling, defined as less than 0.5 liters. Wilcox advises using a normal distribution graph to visualize the problem and calculate the z-score for the boundary value, leading to a probability of underfilling of approximately 0.062. The second scenario involves boxes of shampoo bottles and the probability of crate rejection based on underfilled bottles.
🔢 Calculating Probability of Crate Rejection
The session continues with the second part of the free response question, which concerns the probability of a crate being rejected due to underfilled shampoo bottles. The random variable X represents the number of under filled bottles in a box of 10, following a binomial distribution with n=10 and a probability of underfilling per bottle of 0.062. To find the probability of crate rejection, which requires two or more under filled bottles, Wilcox uses the complement rule, subtracting the probability of 0 or 1 under filled bottle from 1. Using the binomial formula, he calculates the probability of rejection to be very low at 0.0017. The company then considers adjusting the filling machine's settings to a new mean of 0.56 liters and standard deviation of 0.03 liters. After comparing the probabilities of underfilling for both settings, Wilcox recommends maintaining the original programming due to a lower probability of underfilled bottles.
🚀 Testing the Performance of Super Igniters
The video script addresses a different scenario involving the testing of a new type of igniter for model rockets, aiming to reduce the failure rate from an estimated 15%. The testing process involves launching rockets with super igniters until a failure occurs or 32 successful launches are achieved. For part A, the probability of the first 30 super igniters all being successful is calculated by raising the success probability (0.85) to the power of 30, resulting in 0.0076. In part B, given the first 30 igniters are successful, the probability of the first failure occurring on the 31st or 32nd igniter is found by considering the two mutually exclusive events and adding their probabilities, yielding 0.2775. Part C poses a question about the reasonableness of believing the failure rate is less than 15% based on the successful launches. Wilcox suggests treating this as a significance test, with the null hypothesis being a 15% failure rate. The low probability of 0.0076 under the null hypothesis provides convincing evidence that the failure rate is indeed less than 15%. The session concludes with a preview of the next video, which will cover data collection.
Mindmap
Keywords
💡AP Stats
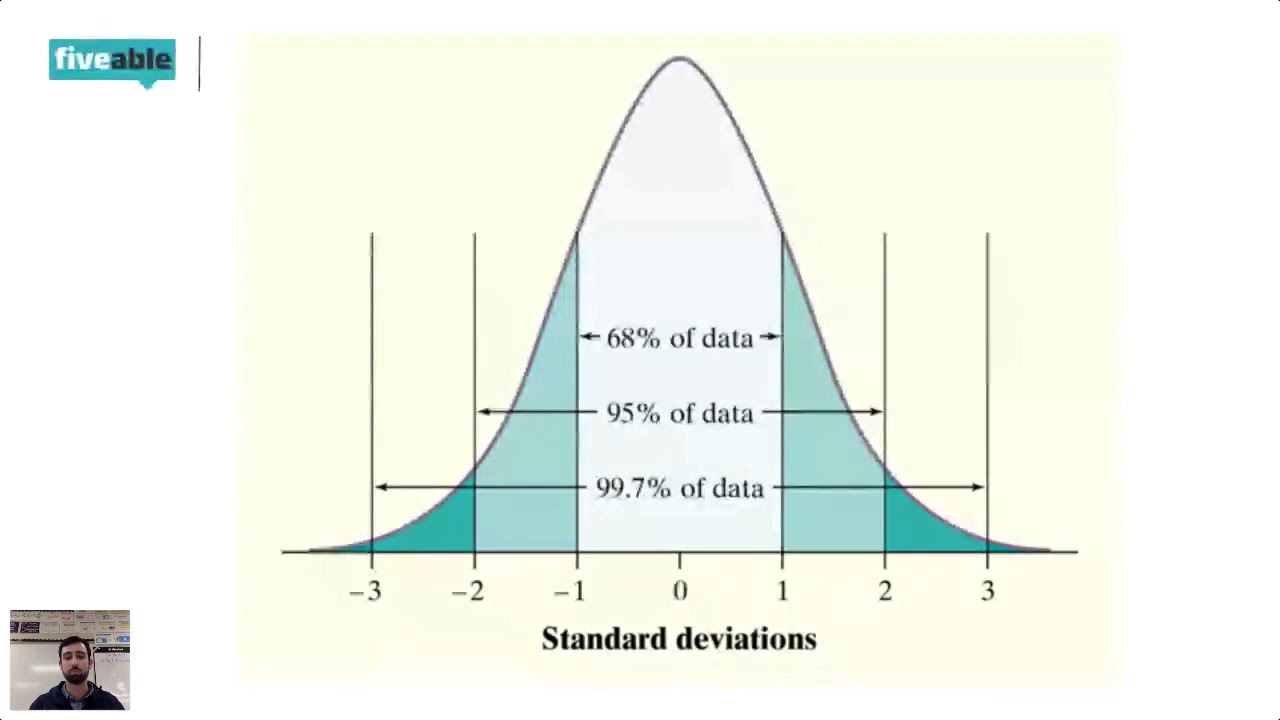
💡Normal Distribution
💡Mean
💡Standard Deviation
💡Z-Score
💡Binomial Distribution
💡Complement Rule
💡Failure Rate
💡Significance Test
💡P-Value
Highlights
Introduction to AP Daily practice sessions by Luke Wilcox, an AP Stats teacher.
Recommendation to try probability questions before watching the video for better understanding.
Explanation of a normal distribution problem involving a shampoo filling machine with a mean of 0.6 liters and standard deviation of 0.04 liters.
Calculation of the probability of under-filled shampoo bottles using the z-score method.
Use of the normal distribution table to find the area corresponding to the z-score for probability calculation.
Introduction of a binomial distribution problem regarding the shipping of shampoo bottles in crates.
Explanation of the binomial distribution and its application to calculate the probability of crate rejection.
Use of the complement rule to simplify the calculation of the probability of crate rejection.
Binomial probability calculation for the number of under-filled bottles in a box of 10.
Discussion on the manufacturing company's consideration to adjust the filling machine's programming.
Statistical justification for choosing between the original and adjusted machine programming based on under-fill probability.
Introduction to the second free response question about model rockets and super igniters.
Testing process for super igniters and its impact on the failure rate calculation.
Calculation of the probability of the first 30 super igniters successfully launching rockets.
Probability calculation for the first failure occurring on the 31st or 32nd super igniter.
Hypothesis testing approach to determine if the super igniter's failure rate is less than 15%.
Significance of the P-value in providing evidence for a lower failure rate than initially estimated.
Conclusion and invitation to the next session on collecting data in AP Stats.
Transcripts
Browse More Related Video

2022 Live Review 2 | AP Statistics | Making Sense of Probability & Random Variables

4 | FRQ (Part A: Multi-Focus) | Practice Sessions | AP Statistics
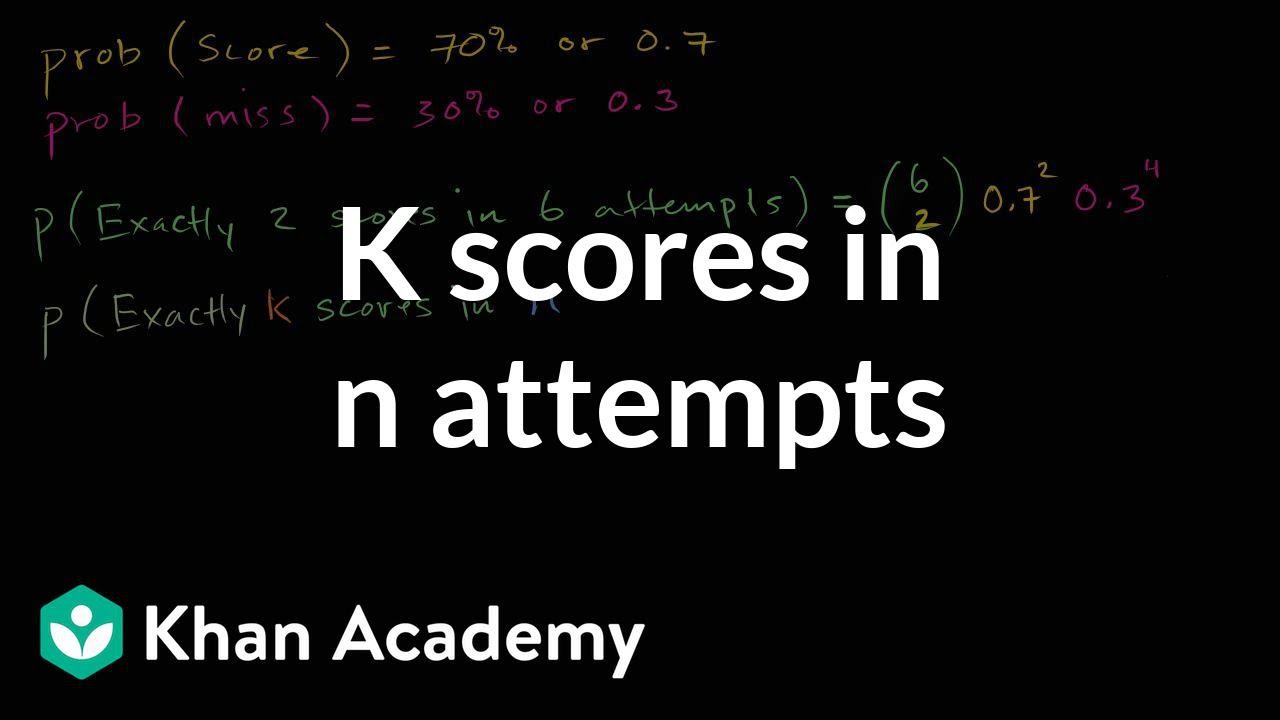
Generalizing k scores in n attempts | Probability and Statistics | Khan Academy
3 | FRQ (Part A: Sampling) | Practice Sessions | AP Statistics
AP Stats - Cram Review (2019)

1 | MCQ | Practice Sessions | AP Statistics
5.0 / 5 (0 votes)
Thanks for rating: