Two Sample t test using SPSS with Dr Ami Gates
TLDRIn this how-to video, Dr. Amy Gates demonstrates how to perform an independent two-sample T-test in SPSS, using a dataset with various attributes like gender, age, and Facebook friends. The focus is on investigating whether a significant difference exists in the number of Facebook friends between individuals who love or hate sports. The video guides viewers through hypothesis formulation, data analysis, and interpretation of the T-test results, concluding that there is a significant correlation between sports preferences and social connectivity.
Takeaways
- 📊 The video is a tutorial on performing a two-sample independent t-test using SPSS.
- 🔍 The importance of understanding the dataset before conducting a statistical test is emphasized.
- 👥 The dataset includes information on gender, age, height, shoe size, hair color, school terms, Facebook friends, and attitudes towards golf and sports.
- 🏷 The representation of data, such as gender as strings or numerical labels, is crucial for proper analysis.
- 🔑 The 'Variable View' in SPSS is used to understand what the values of a variable represent, such as the scale for liking sports.
- ⚽ The research question asks if there's a significant difference in the number of Facebook friends between people who love or hate sports.
- 🧐 The null hypothesis states there's no significant difference in the mean number of Facebook friends between the two groups.
- 🤔 The alternative hypothesis suggests that there is a difference in the mean number of Facebook friends based on sports preference.
- 📝 The tutorial demonstrates how to select the appropriate test in SPSS and set up the groups for comparison.
- 📊 The results of the t-test are interpreted based on the F test and P value to determine if variances are equal.
- 📉 The final conclusion is that there is a significant difference in the number of Facebook friends between those who love and hate sports, rejecting the null hypothesis.
Q & A
What is the main focus of the video?
-The video focuses on how to perform a two-sample independent t-test using SPSS, specifically to analyze the relationship between liking or disliking sports and the number of Facebook friends a person has.
Why is it important to understand the data set before performing a statistical test?
-Understanding the data set is crucial because it helps to ensure that the data is correctly represented and interpreted, which is essential for the accuracy and validity of any statistical analysis.
What does the 'Golf and Sports' variable represent in the data set?
-The 'Golf and Sports' variable represents the level of interest in sports, with values ranging from 1 (least favorite or not liking sports) to 5 (very sports-oriented).
How does the video script suggest defining the two groups for the t-test?
-The script suggests defining the two groups based on extreme values of the 'Golf and Sports' variable: Group 1 for those who least like sports (value 1) and Group 2 for those who like sports the most (value 5).
What is the research question posed in the script?
-The research question is whether there is a significant difference in the mean number of Facebook friends between people who love sports and those who do not.
What is the null hypothesis for the t-test described in the video?
-The null hypothesis states that there is no significant difference between the mean number of Facebook friends for Group 1 (people who do not like sports) and Group 2 (people who like sports).
What is the alternative hypothesis in the context of this video?
-The alternative hypothesis is that there is a significant difference in the mean number of Facebook friends between the two groups, suggesting that the level of interest in sports affects the number of Facebook friends.
How does the video script guide the use of SPSS for the t-test?
-The script guides the viewer through the process of selecting the 'Analyze', 'Compare Means', and 'Independent-Samples T Test' options in SPSS, defining the grouping variable, and specifying the test variable for comparison.
What does the video script suggest about the relationship between the 'Golf and Sports' variable and the number of Facebook friends?
-The script suggests a hypothesis that there might be a significant difference in the number of Facebook friends based on whether individuals love or hate sports, which is tested using the t-test in SPSS.
How does the script interpret the results of the t-test in SPSS?
-The script interprets the t-test results by first checking the F test's P value to determine if the variances are equal. Then, based on the T value and its associated P value, it concludes whether to reject the null hypothesis and support the research hypothesis.
What conclusion does the video script draw from the t-test results?
-The script concludes that there is significant evidence to support the research hypothesis that the level of interest in sports affects the number of Facebook friends a person has, as indicated by a lower average number of Facebook friends among those who do not like sports.
Outlines
📊 Introduction to Two Sample Independent T-Test in SPSS
The video script begins with an introduction to a statistical tutorial led by Dr. Amy Gates, focusing on performing a two-sample independent T-test using SPSS. The first step emphasized is understanding the dataset, which in this case includes various attributes of individuals such as gender, age, shoe size, and Facebook friends count. The script highlights the importance of recognizing how data is represented, especially when categorical data like gender is presented as strings rather than numerical values. The dataset also includes a variable for sports interest, rated on a scale from one to five, where the values are explained through the Variable View in SPSS. The hypothesis for the T-test is introduced, which is to determine if there is a significant difference in the number of Facebook friends between individuals who love (rating of five) and hate (rating of one) sports.
🔍 Setting Up the Independent Samples T-Test in SPSS
The script continues with a detailed explanation of how to set up and execute an independent samples T-test in SPSS. It clarifies why this specific type of T-test is chosen based on the independence of the two groups being compared—those who love and those who hate sports. The process involves selecting the appropriate variables in SPSS, defining the groups based on the sports interest ratings, and choosing the number of Facebook friends as the test variable. The script also explains the significance of setting the correct Alpha value for the test and how to interpret the SPSS output, including the means of both groups and the subsequent T-test results.
📉 Analyzing the Results of the T-Test
The final paragraph of the script discusses the analysis of the T-test results obtained from SPSS. It explains the initial step of determining whether to assume equal variances between the two groups by examining the P-value of the F-test. If the P-value is less than the Alpha value (0.05), the variances are considered unequal, directing the focus to the appropriate row of the T-test results. The script then describes how to interpret the T-value and its corresponding P-value to make a conclusion about the hypothesis. In this case, the P-value is less than 0.05, leading to the rejection of the null hypothesis and supporting the research hypothesis that there is a significant difference in the number of Facebook friends based on sports interest. The video concludes with a summary of the findings and an invitation to join future tutorials.
Mindmap
Keywords
💡Two Sample Independent T-test
💡Data Set
💡Variable View
💡Grouping Variable
💡Null Hypothesis
💡Alternative Hypothesis (Ha)
💡SPSS
💡Mean
💡Significance Level (Alpha)
💡P-Value
💡Confidence Interval
Highlights
Introduction to a how-to video on performing a two-sample independent t-test using SPSS
Importance of understanding the dataset before conducting any statistical test
Explanation of how gender is represented as strings (male or female) in the dataset
The significance of examining the Variable View for understanding variable representations
Clarification of the 'golf' variable representing sports preferences with numerical values
The research question: Does liking or disliking sports affect the number of Facebook friends?
Formulation of the null hypothesis assuming no significant difference in Facebook friends between groups
Formulation of the alternative hypothesis suggesting a difference in Facebook friends count
Description of the grouping variable based on extreme sports preferences (1s and 5s)
Selection of the number of Facebook friends as the variable for comparison
Guidance on navigating SPSS to perform an independent samples t-test
Instructions on defining groups in SPSS based on the 'golf' variable
Explanation of choosing the independent samples t-test for separate non-overlapping groups
Details on setting the confidence interval and alpha value for the t-test in SPSS
Interpretation of the t-test results, focusing on the mean number of Facebook friends in each group
Decision-making process on which row of results to use based on the assumption of equal variances
Final conclusion that there is a significant difference in Facebook friends based on sports preferences
Summary of the practical application of an independent t-test in SPSS for social science research
Transcripts
Browse More Related Video
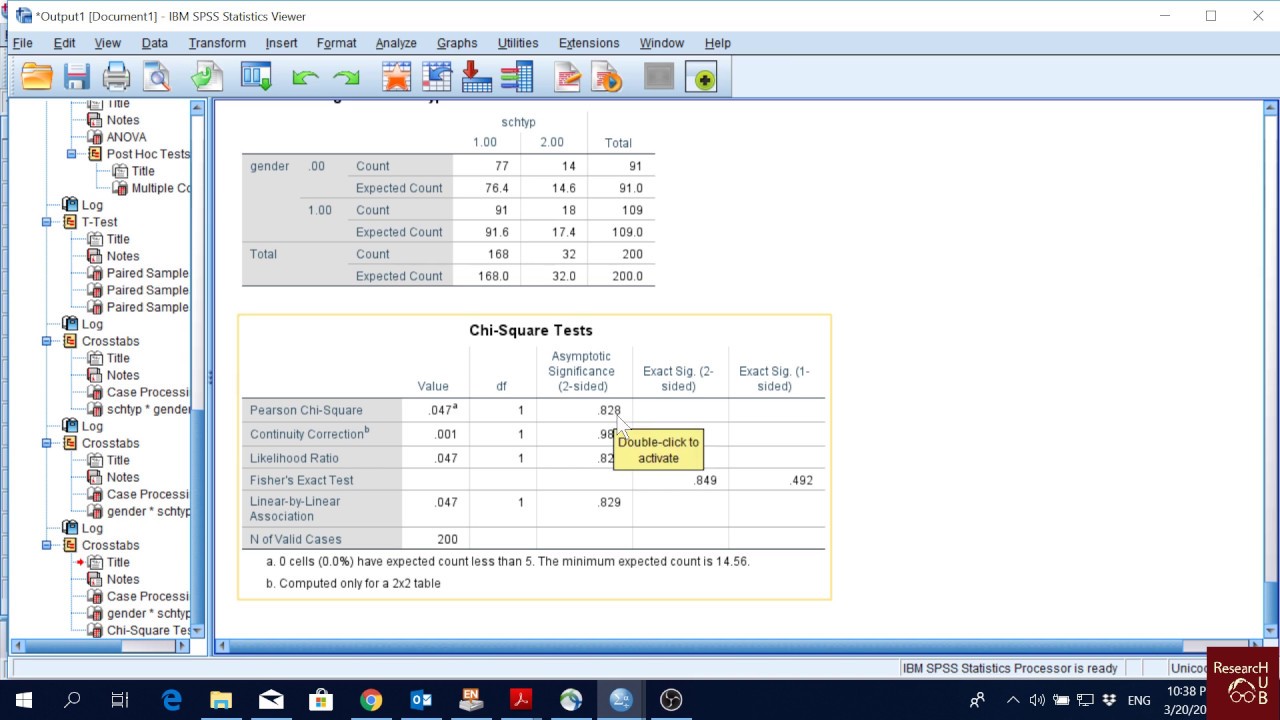
SPSS (10): Chi-Square Test
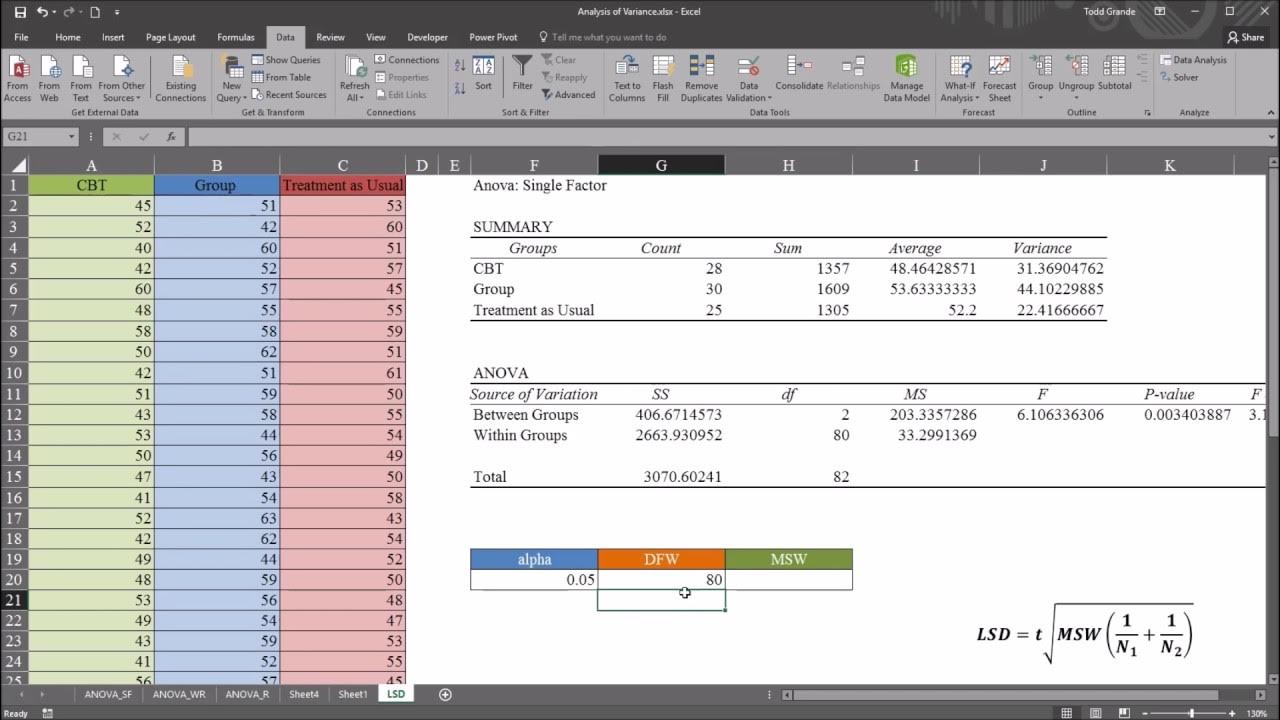
One-Way ANOVA with LSD (Least Significant Difference) Post Hoc Test in Excel
Three Different t tests using SPSS with Dr Ami Gates

t-Test - Full Course - Everything you need to know
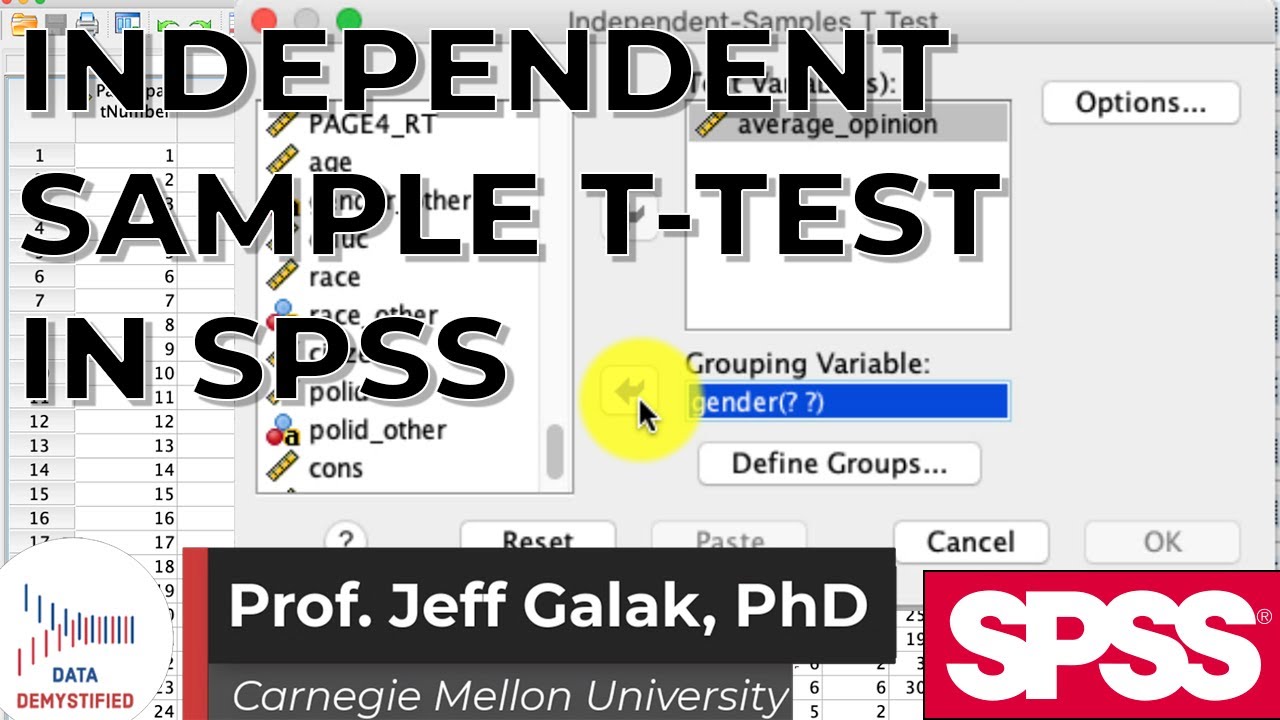
Independent Sample t-Test in SPSS Tutorial (SPSS Tutorial Video #13) - Comparing Two Groups
Two-Sample t Test in R (Independent Groups) with Example | R Tutorial 4.2 | MarinStatsLectures
5.0 / 5 (0 votes)
Thanks for rating: