AP Precalculus Practice Exam Question 28
TLDRIn this educational video, the presenter explores the polar function R = f(θ) = 1 + 2sin(θ) within the range 0 ≤ θ ≤ 2π. They create a table of values for θ and plot the graph, revealing a spiral pattern. The presenter then solves for when the radius is zero, finding the points where the graph touches the pole at 7π/6 and 11π/6. The video concludes by evaluating statements about the distance between the graph and the origin, with the correct answer being that the distance increases from zero to 2π, as R is positive and increasing on this interval.
Takeaways
- 📚 The video discusses the polar graph of a function \( R = f(\theta) \) where \( f(\theta) = 1 + 2\sin(\theta) \) within the range \( 0 \leq \theta \leq 2\pi \).
- 📝 The presenter begins by creating a table of values for \( \theta \) and \( R \) to sketch the graph, starting from \( \theta = 0 \) to \( 2\pi \).
- 📈 At \( \theta = 0 \), the value of \( R \) is 1, indicating a point on the polar graph at a distance of 1 from the origin.
- 📉 The graph's behavior is analyzed at specific angles, including \( \pi/2 \), \( \pi \), and \( 3\pi/2 \), revealing increases and decreases in the radius.
- 🔍 The presenter identifies that the graph will hit the pole at certain angles, specifically between \( \pi \) and \( 3\pi/2 \), and then from \( 3\pi/2 \) to \( 2\pi \).
- 🧩 The solution to \( 1 + 2\sin(\theta) = 0 \) is found to be at \( \theta = 7\pi/6 \) and \( 11\pi/6 \), indicating points where the graph touches the pole.
- 📊 The graph is described as having a spiral motion, with specific points analyzed for their distance from the origin.
- 🔎 The presenter evaluates several statements about the distance between the point with polar coordinate \( (f(\theta), \theta) \) and the origin.
- ✅ Statement A is identified as true, suggesting the distance increases from 0 to \( 2\pi \) because \( f(\theta) \) is positive and increasing on the interval.
- ❌ Statement B is refuted as it suggests the distance increases from \( 3\pi/2 \) to \( 11\pi/6 \), which is incorrect since the distance is decreasing.
- ❌ Statement C is also incorrect, as it contradicts the increasing distance from 0 to \( 2\pi \) identified in Statement A.
- ❌ Statement D is incorrect because it suggests the distance decreases from \( 3\pi/2 \) to \( 11\pi/6 \), but the presenter's analysis shows an increase.
Q & A
What is the polar function given in the script?
-The polar function given is R = f(θ) = 1 + 2sin(θ).
What is the range of θ for the polar function?
-The range of θ is from 0 to 2π.
What is the initial value of R when θ is 0?
-When θ is 0, the value of R is 1 because sin(0) is 0, so R = 1 + 2(0) = 1.
What happens to the radius R when θ is π?
-When θ is π, sin(π) is 0, so the radius R remains 1, as R = 1 + 2(0) = 1.
At what angle does the radius R become negative?
-The radius R becomes negative when θ is 3π/2, because sin(3π/2) is -1, making R = 1 + 2(-1) = -1.
What is the significance of the negative radius in the polar plot?
-A negative radius indicates that the point is located on the positive y-axis, as the radius is the distance from the origin, and a negative value suggests a reflection across the x-axis.
What are the θ values where the curve hits the pole (R = 0)?
-The curve hits the pole at θ values of 7π/6 and 11π/6, where sin(θ) equals -1/2.
Why does the curve not complete a full cycle at 2π according to the script?
-The curve does not complete a full cycle at 2π because the function has points where R = 0 (at 7π/6 and 11π/6), which interrupts the continuity of the spiral motion.
What is the correct statement about the distance between the point with polar coordinate (R, θ) and the origin?
-Statement A is correct: The distance is increasing from 0 to 2π because R is positive and increases on the interval.
Why is statement B incorrect according to the script?
-Statement B is incorrect because the distance is not increasing from 3π/2 to 11π/6; it is actually decreasing as the radius goes from -1 to 0.
What makes statement C incorrect?
-Statement C is the contradiction of A, claiming the distance is decreasing from 0 to 2π, which is false as previously established that the distance is increasing.
Why is statement D also incorrect?
-Statement D is incorrect because, although the radius is negative, the distance to the origin is not decreasing but increasing as the radius approaches zero from a negative value.
Outlines
📚 Analyzing the Polar Function Graph
The speaker begins by addressing a question about the polar function R = 1 + 2sin(θ), with θ ranging from 0 to 2π. The approach involves sketching the graph by creating a table of values for θ and calculating the corresponding R values. The process includes plotting these points on a polar coordinate system to visualize the spiral-like pattern. The speaker identifies critical points where the graph touches the pole at specific angles, determined by setting the function equal to zero and solving for θ. This results in finding angles 7π/6 and 11π/6 where the radius is zero, indicating the points of intersection with the pole.
🔍 Evaluating Statements on Distance Variation
The speaker proceeds to evaluate several statements regarding the distance between points on the polar curve and the origin. Statement A suggests that the distance is increasing from 0 to 2π, which the speaker initially agrees with, based on the observed increase in radius values. Statement B claims the distance increases from 3π/2 to 11π/6, which is refuted as the radius decreases, indicating the distance to the origin is getting smaller. Statement C, the contradiction of A, is dismissed as false since the distance was established to be increasing. Statement D asserts the distance decreases from 3π/2 to 11π/6, which the speaker corrects, noting that the negative radius values are actually approaching zero, signifying an increase in distance, not a decrease. After the analysis, the speaker concludes that the only true statement is A, confirming the initial observation of increasing distance along the curve.
Mindmap
Keywords
💡Polar Function
💡Polar Coordinates
💡Theta (θ)
💡Sine Function
💡Graph Sketching
💡Radius (R)
💡Unit Circle
💡Pole
💡Increasing Function
💡Decreasing Function
💡Trigonometric Values
Highlights
Introduction to the polar function R = f(θ) with f(θ) = 1 + 2sin(θ).
Exploration of the graph by creating a table of values for θ from 0 to 2π.
Calculation of R values at specific angles: 0, π/2, π, and 3π/2.
Observation of a spiral-like motion in the graph's plot.
Identification of the polar curve's pole-hitting points between π and 3π/2.
Solution for when the radius is zero by setting 1 + 2sin(θ) = 0.
Inclusion of θ values 7π/6 and 11π/6 where the curve hits the pole.
Analysis of the distance between the point with polar coordinate (f(θ), θ) and the origin.
Statement A: The distance increases from 0 to 2π due to positive and increasing R values.
Statement B: Incorrect, as the distance decreases from 3π/2 to 11π/6, not increasing.
Statement C: Contradiction of A, claiming the distance decreases from 0 to 2π, which is false.
Statement D: Incorrect, as the distance is not decreasing but increasing from 3π/2 to 11π/6.
Conclusion that the only true statement is A, confirming the increasing distance.
Discussion of the significance of positive and negative R values in the context of the graph.
Explanation of how the graph's spiral pattern affects the perceived distance from the origin.
Final summary emphasizing the importance of understanding polar functions and their graphical behavior.
Transcripts
Browse More Related Video

AP Precalculus Practice Exam Question 25
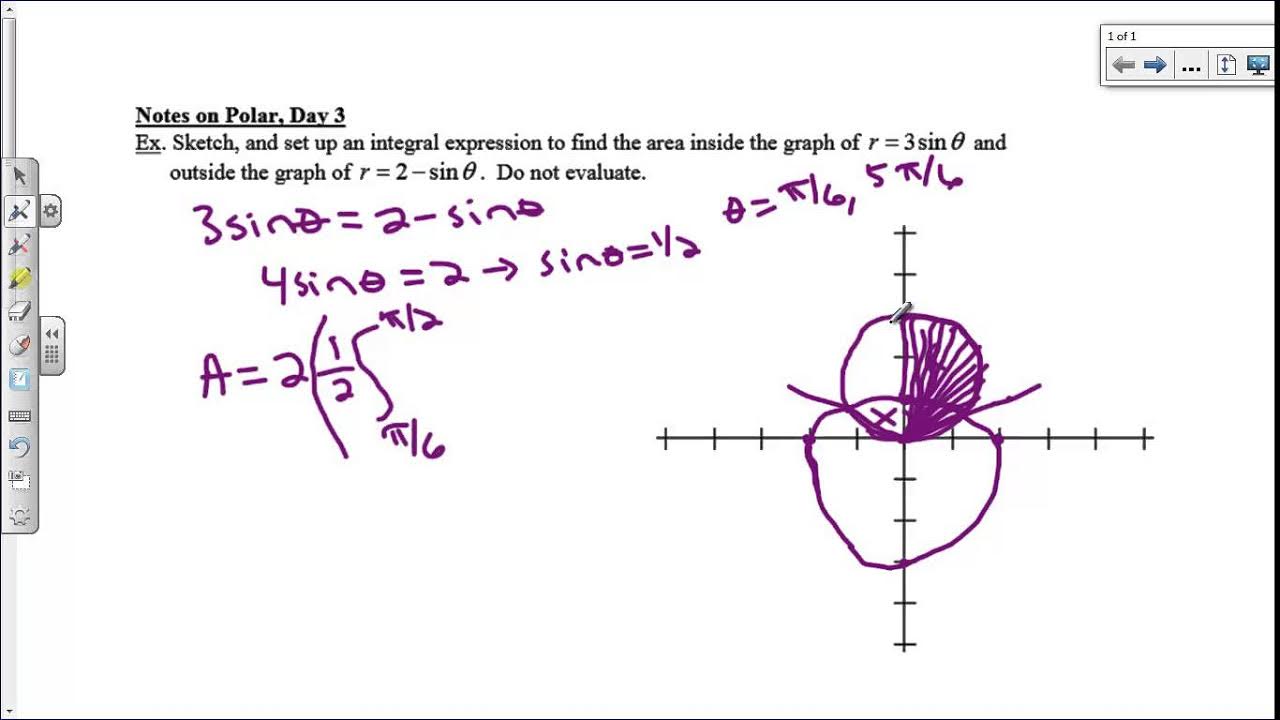
Notes on Polar, Day 3

Graph of r = 1 + cos(theta/2) | MIT 18.01SC Single Variable Calculus, Fall 2010
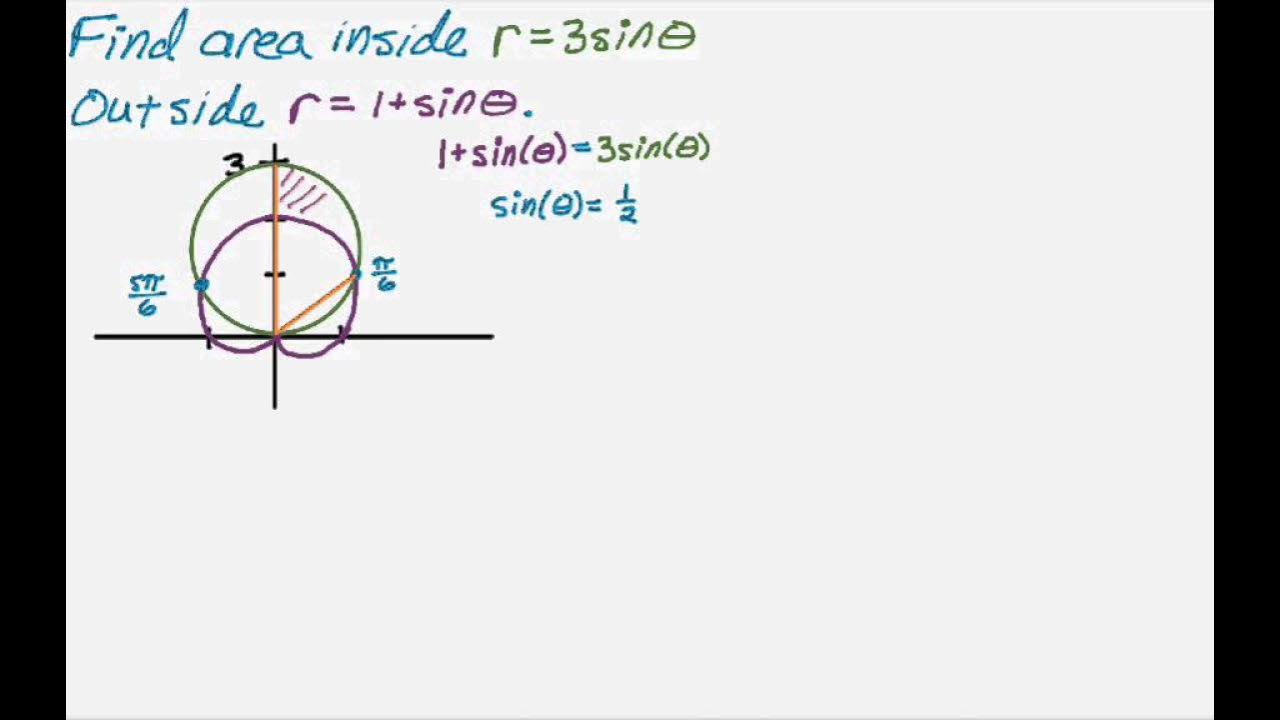
Calculus Polar Area Region Between Curves Example
How To Graph Polar Equations

Polar coordinates 2 | Parametric equations and polar coordinates | Precalculus | Khan Academy
5.0 / 5 (0 votes)
Thanks for rating: