Animation on How to Price Ceilings with Calculations
TLDRThis video script explores the concept of price ceilings and their effects on consumer and producer surplus. It demonstrates through a graphical analysis how an equilibrium price and quantity are determined, and how imposing a price ceiling can lead to a shortage, changes in surpluses, and a deadweight loss to society. The script uses a step-by-step approach with a table and diagrams to illustrate the calculations of surpluses before and after the price ceiling, providing a clear understanding of economic impacts.
Takeaways
- 📈 The video discusses the concept of price ceilings and their effects on consumer and producer surplus.
- 📊 The equilibrium price and quantity are both $10 and 10 units, respectively, with a demand curve intercept of $20 and a supply curve intercept of $2.
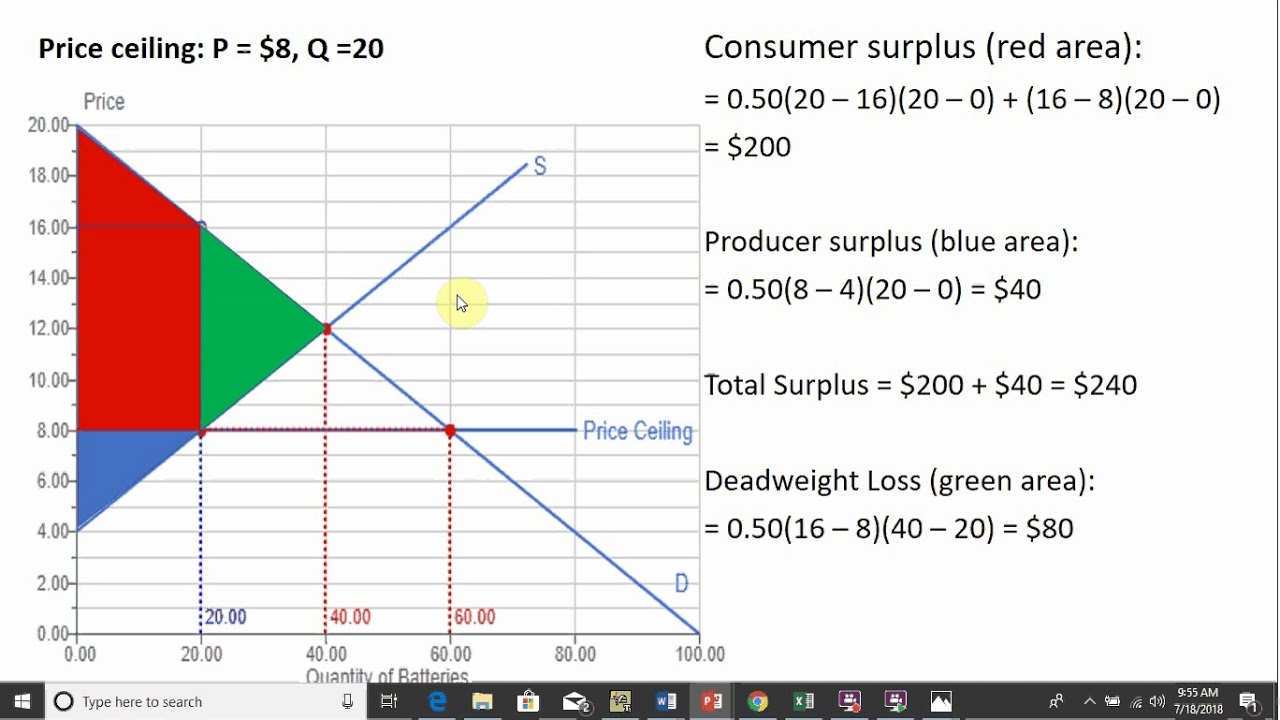
- 🔍 Producer surplus at equilibrium is calculated as the area of a triangle with a base of 10 and a height of 8, equaling 40.
- 🛒 Consumer surplus at equilibrium is the area below the demand curve and above the price, which is a triangle with an area of 50.
- 💰 Total surplus at equilibrium is the sum of consumer and producer surplus, totaling 90.
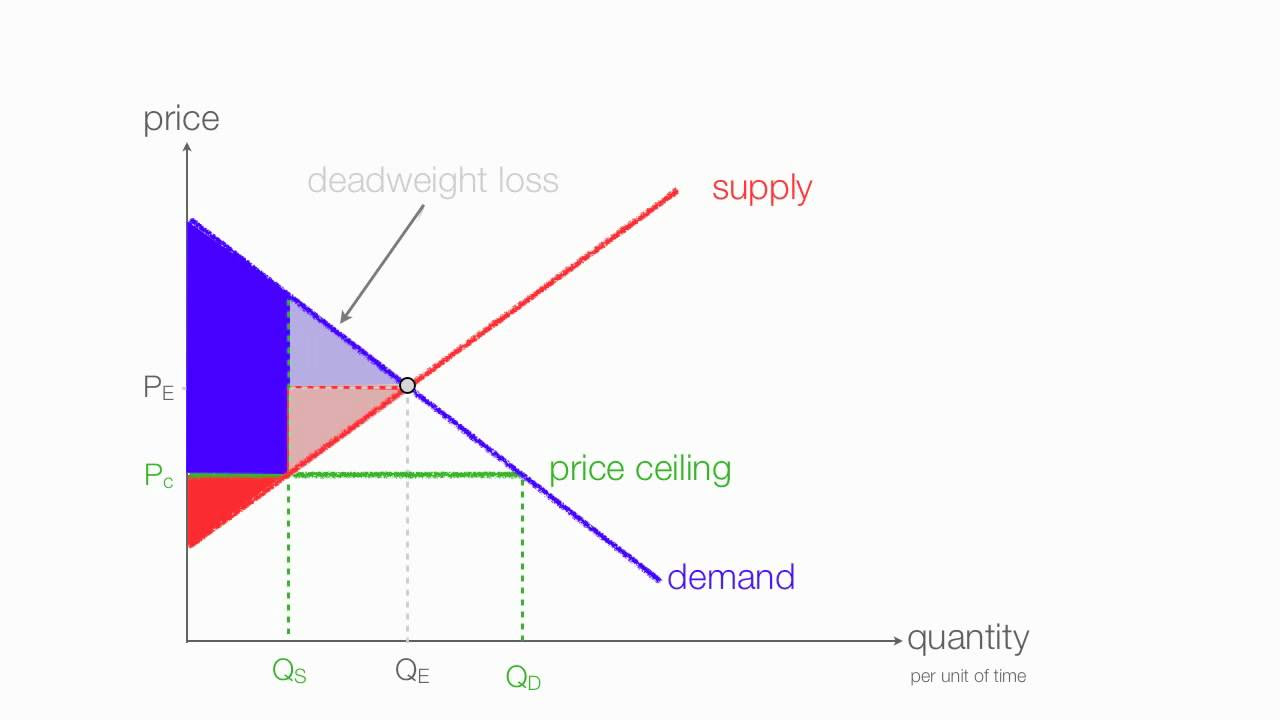
- 🚫 A price ceiling set at $6 leads to a shortage as the quantity demanded exceeds the quantity supplied, resulting in a shortage of 9 units.
- 📉 The imposition of a price ceiling reduces producer surplus by 30, calculated as the area of a new triangle with a base of 5 and a height of 4.
- 📈 Consumer surplus after the price ceiling increases by 7.5, combining the area of a triangle and a rectangle formed by the price ceiling.
- 🔢 Deadweight loss to society is calculated by subtracting the new total surplus from the original total surplus, resulting in a loss of 22.5.
- 📚 The video provides a step-by-step explanation of how to calculate the effects of a price ceiling on market surpluses and deadweight loss.
- 🔗 The video encourages viewers to follow on social media and subscribe for more economic content.
Q & A
What is the main topic discussed in the video?
-The main topic discussed in the video is price ceilings and their impact on consumer surplus and producer surplus.
What is the equilibrium price and quantity in the example provided?
-In the example, the equilibrium price is $10, and the equilibrium quantity is 10 units per unit of time.
How is producer surplus calculated in the equilibrium scenario?
-Producer surplus is calculated as the area above the supply curve and below the price, which is a triangle with a base of 10 and height of 8, resulting in an area of 40.
What is consumer surplus and how is it calculated in the equilibrium scenario?
-Consumer surplus is the area below the demand curve and above the price. It is calculated as the area of a triangle with a base and height of 10, resulting in an area of 50.
What is the total surplus at equilibrium and what does it represent?
-The total surplus at equilibrium is 90, which represents the sum of consumer surplus and producer surplus, indicating the total economic benefit to society.
What happens when a price ceiling of six dollars is imposed?
-When a price ceiling of six dollars is imposed, it causes a shortage because the quantity demanded (14 units) is greater than the quantity supplied (5 units).
How does the producer surplus change after the imposition of the price ceiling?
-Producer surplus is reduced after the imposition of the price ceiling. It goes from the original area to a new triangular area with a base of 5 and height of 4, resulting in a reduction of 30.
What is the new consumer surplus after the price ceiling is imposed?
-The new consumer surplus is the sum of the area of a triangle (12.5) and a rectangle (45), totaling 57.5, which is an increase of 7.5 from the equilibrium consumer surplus.
How is deadweight loss calculated and what does it represent?
-Deadweight loss is calculated by subtracting the new total surplus (57.5) from the original total surplus (90), resulting in a loss of 32.5. It represents the loss of total surplus to society due to market inefficiency caused by the price ceiling.
What is the relationship between the price ceiling and the shortage in the video?
-The price ceiling is set below the equilibrium price, leading to a higher quantity demanded than supplied, which results in a shortage.
How does the video illustrate the concept of deadweight loss visually?
-The video illustrates deadweight loss by showing the reduction in total surplus due to the price ceiling, represented by the area between the two triangles formed by the demand and supply curves and the price ceiling line.
Outlines
📊 Impact of Price Ceilings on Surpluses and Shortages
This paragraph introduces the concept of price ceilings and their effects on consumer and producer surpluses. It explains the equilibrium in a market with a demand curve intercept of $20 and a supply curve intercept of $2, resulting in an equilibrium price and quantity of $10 each. The paragraph details how to calculate producer surplus as the area of a triangle formed by the supply curve and price, and consumer surplus as the area under the demand curve and above the price. The total surplus at equilibrium is given as 90, with no deadweight loss. The imposition of a price ceiling at $6 leads to a shortage, as quantity demanded (14) exceeds quantity supplied (5), causing a shortage of 9 units. The new producer surplus is calculated, showing a reduction, and the consumer surplus is recalculated, including both the reduced triangle area and the new rectangular area formed by the price ceiling, resulting in an increase of 7.5. The paragraph concludes by outlining the changes in surpluses due to the price ceiling.
📉 Deadweight Loss and Social Impact of Price Ceilings
The second paragraph delves into the consequences of the price ceiling imposed in the previous section, focusing on the calculation of consumer surplus after the price ceiling and the resulting deadweight loss to society. It explains that consumer surplus increases slightly due to the new rectangular area formed by the price ceiling, but overall, there is a significant deadweight loss calculated by subtracting the new total surplus (57.5) from the original surplus at equilibrium (90), resulting in a loss of 32.5. The paragraph also demonstrates an alternative method to determine deadweight loss by calculating the area of two triangles formed by the price ceiling and equilibrium price, which confirms the loss of 22.5. The summary concludes by emphasizing the decrease in producer surplus, the slight increase in consumer surplus, and the overall negative impact of the price ceiling on society, including the creation of a shortage.
Mindmap
Keywords
💡Price Ceilings
💡Consumer Surplus
💡Producer Surplus
💡Equilibrium Price
💡Equilibrium Quantity
💡Demand Curve
💡Supply Curve
💡Shortage
💡Deadweight Loss
💡Total Surplus
💡Quantity Demanded
Highlights
Introduction to the topic of price ceilings and their effects on consumer and producer surplus.
Explanation of the demand and supply curves with their respective intercepts at $20 and $2.
Identification of the equilibrium price and quantity both at $10 and 10 units.
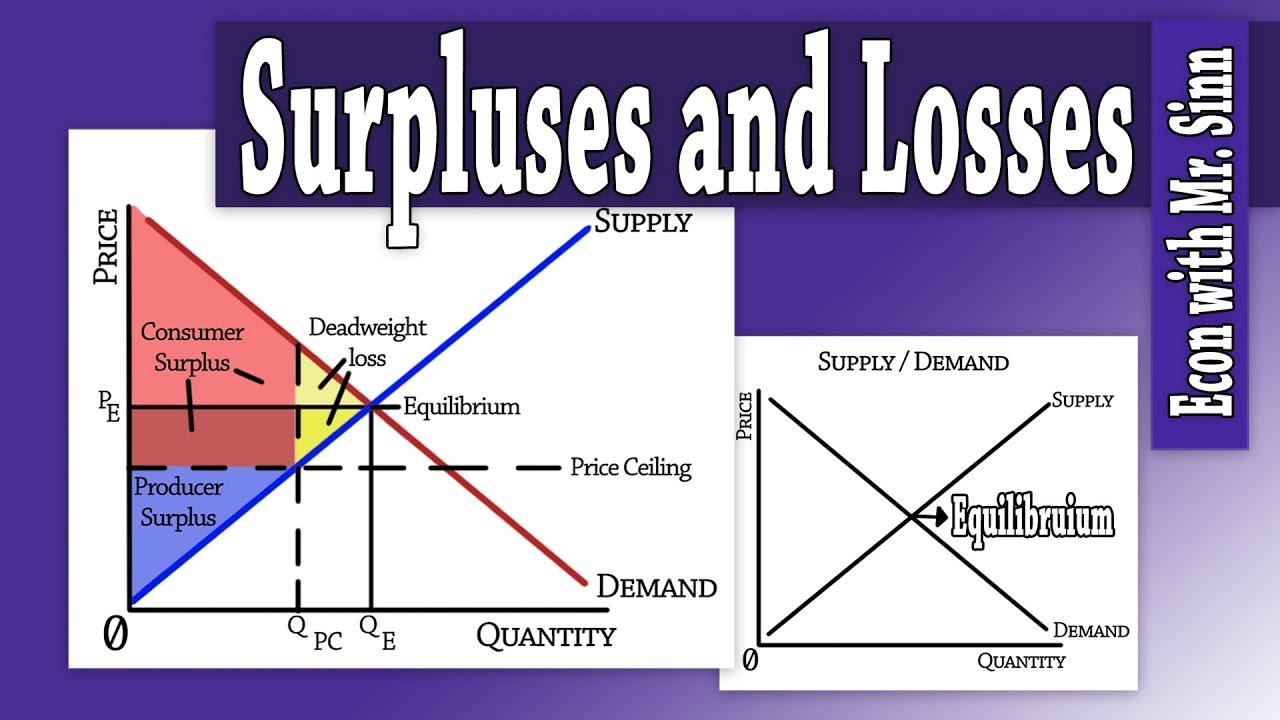
Calculation of producer surplus as the area above the supply curve and below the equilibrium price.
Explanation of consumer surplus as the area below the demand curve and above the equilibrium price.
Total surplus calculation as the sum of consumer and producer surplus at equilibrium.
Introduction of a price ceiling at $6 and its impact on quantity demanded and supplied.
Discussion of the resulting shortage due to the price ceiling leading to a higher quantity demanded than supplied.
Reduction in producer surplus due to the imposed price ceiling.
Increase in consumer surplus despite the price ceiling, with a new calculation provided.
Calculation of the new consumer surplus including the area of a triangle and a rectangle.
Introduction of deadweight loss as the reduction in total surplus due to the price ceiling.
Explanation of how to calculate deadweight loss using the areas of two triangles.
Visual demonstration of the impact of the price ceiling on producer surplus, consumer surplus, and deadweight loss.
Summary of the effects of a price ceiling, including changes in surpluses and the occurrence of a shortage.
Encouragement for viewers to engage with the content on social media and subscribe for more videos.
Transcripts
Browse More Related Video

Consumer Surplus, Producer Surplus,& Deadweight Loss before and after imposing the price ceiling?
Price Ceiling: Consumer Surplus, Producer Surplus, & Deadweight loss
How to calculate changes in consumer and producer surplus with price and floor ceilings.
Consumers 'surplus Producers' Surplus , Total surplus, deadweight loss with price floor

Price Ceiling Practice Problem | (STEP-BY-STEP SOLUTION)| PART 1 | Think Econ
Consumer/Producer Surplus & Deadweight Loss
5.0 / 5 (0 votes)
Thanks for rating: