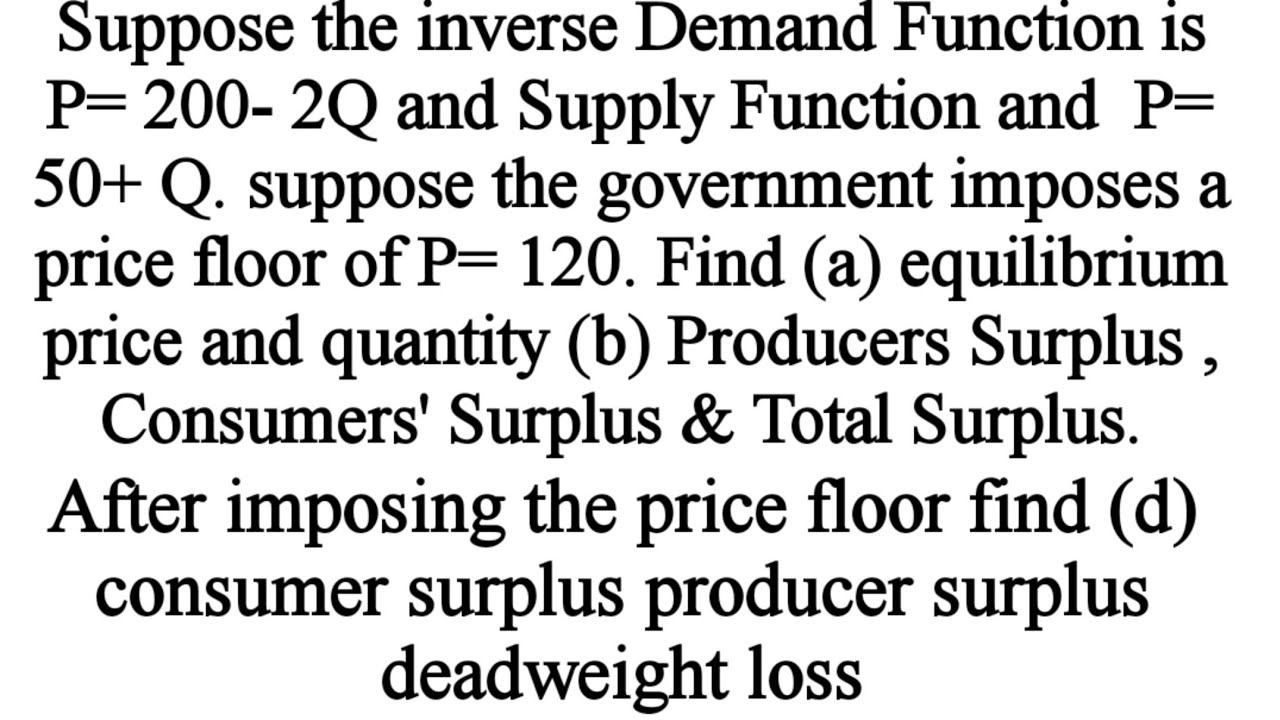
Consumer Surplus, Producer Surplus,& Deadweight Loss before and after imposing the price ceiling?
TLDRThis video script tackles a supply and demand problem involving sandwiches with unique functions, where supply is 500p - 1000 and demand is 11000 - 1000p. It explains the concept of a price ceiling and calculates consumer and producer surplus before and after imposing a $4 price cap. The equilibrium price is found to be $8, leading to a surplus of $13,500. After the price ceiling, surpluses are recalculated, resulting in a new consumer surplus of $6,500, producer surplus of $1,000, and a deadweight loss of $6,000, illustrating the impact of price controls on market efficiency.
Takeaways
- 📈 The video discusses a problem involving supply and demand functions for sandwiches with specific equations given for supply and demand.
- 💡 A price ceiling, also known as a price cap, is defined as the maximum price at which goods can be sold, acting as a form of price control.
- 🔍 The equilibrium price and quantity are calculated by setting the supply function equal to the demand function, resulting in an equilibrium price of $8.
- 📊 The equilibrium quantity is found by substituting the equilibrium price back into either the supply or demand function, yielding a quantity of 3,000 sandwiches.
- 🤔 Consumer surplus is calculated as the area below the demand curve and above the equilibrium price, amounting to 4,500 in this scenario.
- 🛒 Producer surplus is determined by the area above the supply curve and below the equilibrium price, which is 9,000 for this example.
- 🔢 The total surplus, which is the sum of consumer and producer surplus, is calculated to be 13,500 before the imposition of a price ceiling.
- 🚫 When a price ceiling of $4 is imposed, it results in a market inefficiency, causing a shortage and a change in both consumer and producer surpluses.
- 📉 The new consumer surplus after the price ceiling is a combination of the area of a triangle and a rectangle, totaling 6,500.
- 📈 The new producer surplus shrinks to 1,000 due to the price ceiling, as the area of the triangle representing it decreases.
- 💔 Deadweight loss, representing the cost to society from market inefficiency, is calculated as the area of a triangle, resulting in a loss of 6,000.
Q & A
What is the supply function for sandwiches in the given problem?
-The supply function for sandwiches is given as 500p - 1000, where p is the price and q is the quantity.
What is the demand function for sandwiches in the given problem?
-The demand function for sandwiches is given as 11,000 - 1,000p, where p is the price and q is the quantity.
What is a price ceiling and how is it described in the script?
-A price ceiling, also called a price cap, is the highest point at which goods can be sold. It is a type of price control, setting the maximum amount sellers can charge for a good.
How do you find the equilibrium price and quantity before the imposition of the price ceiling?
-To find the equilibrium price and quantity, set the quantity supplied equal to the quantity demanded and solve for the price. Then, substitute the equilibrium price back into either function to find the equilibrium quantity.
What are the equilibrium price and quantity for sandwiches before the price ceiling is imposed?
-The equilibrium price is $8, and the equilibrium quantity is 3,000 sandwiches.
How is the consumer surplus calculated before the imposition of the price ceiling?
-Consumer surplus is the area below the demand curve and above the equilibrium price, which is calculated as 0.5 * (11 - 8) * 3,000, resulting in a consumer surplus of $4,500.
How is the producer surplus calculated before the imposition of the price ceiling?
-Producer surplus is the area above the supply curve and below the equilibrium price, which is calculated as 0.5 * (8 - 2) * 3,000, resulting in a producer surplus of $9,000.
What is the total surplus before the imposition of the price ceiling?
-The total surplus before the imposition of the price ceiling is the sum of the consumer surplus and producer surplus, which is $4,500 + $9,000 = $13,500.
What happens to the quantity supplied and demanded when a price ceiling of $4 is imposed?
-When a price ceiling of $4 is imposed, the quantity supplied is 1,000 sandwiches, and the quantity demanded is greater than the quantity supplied, leading to a shortage.
How is the new consumer surplus calculated after the imposition of the price ceiling?
-The new consumer surplus is the area below the demand curve and above the price ceiling, which is composed of a triangle and a rectangle. It is calculated as 0.5 * (11 - 10) * 1,000 + 6 * 1,000, resulting in a consumer surplus of $6,500.
How is the new producer surplus calculated after the imposition of the price ceiling?
-The new producer surplus is the area above the supply curve and below the price ceiling, which is calculated as 0.5 * (4 - 2) * 1,000, resulting in a producer surplus of $1,000.
What is the deadweight loss due to the imposition of the price ceiling?
-The deadweight loss is the cost to society created by market inefficiency, calculated as the area of the triangle formed between the demand and supply curves at the new quantity supplied. It is calculated as 0.5 * (10 - 4) * (3,000 - 1,000), resulting in a deadweight loss of $6,000.
Outlines
📚 Introduction to Price Ceiling and Supply-Demand Analysis
The video begins by introducing a problem regarding supply and demand functions for sandwiches, posed by a friend on a Telegram channel. The supply function is given as 500p - 1000, and the demand function as 11,000 - 1,000p, where p is the price and q is the quantity. A price ceiling of $4 is imposed, and the task is to calculate the consumer surplus, producer surplus, and deadweight loss before and after this price control measure. The concept of a price ceiling is explained as the maximum price at which goods can be sold, acting as a form of price control. The video then proceeds to find the equilibrium price and quantity before the price ceiling is imposed, using the supply and demand equations to solve for p and q, resulting in an equilibrium price of $8 and quantity of 3,000 units.
📈 Calculating Intercepts and Surpluses Before Price Ceiling
The second paragraph delves into the process of calculating the intercepts of the supply and demand curves to understand the market conditions before the price ceiling. The supply curve intercept is found to be at a price of $2, and the demand curve intercept at $11. Using these intercepts, along with the equilibrium price and quantity, the video calculates the consumer surplus as the area of a triangle formed by the demand curve, equilibrium price, and quantity. The consumer surplus is determined to be 4,500 units of currency. Similarly, the producer surplus is calculated as the area between the supply curve and the equilibrium price, resulting in a producer surplus of 9,000 units. The total surplus, which is the sum of consumer and producer surplus, is then presented as 13,500 units.
🛑 Impact of Price Ceiling on Market Surpluses
In the third paragraph, the video discusses the impact of the imposed price ceiling of $4 on the market. It explains that at this price, the quantity supplied would be 1,000 units, as calculated using the supply function with p=4. However, the quantity demanded would greatly exceed the supplied amount, leading to a shortage. The video then calculates the new consumer surplus under the price ceiling, which is a combination of the area of a triangle and a rectangle, resulting in a new consumer surplus of 6,500 units. The producer surplus is recalculated as well, shrinking to 1,000 units due to the price ceiling's effect on the market dynamics.
📉 Deadweight Loss and Market Inefficiency
The fourth paragraph focuses on the concept of deadweight loss, which is the cost to society created by market inefficiency when supply and demand are out of equilibrium due to price controls like the price ceiling. The video identifies the deadweight loss as the area of a triangle formed by the difference between the equilibrium quantity and the quantity supplied at the price ceiling, and the difference between the equilibrium price and the price ceiling. The calculation results in a deadweight loss of 6,000 units, indicating the inefficiency and loss of total surplus caused by the price ceiling.
🙌 Conclusion and Call to Action
The final paragraph wraps up the video by summarizing the effects of the price ceiling on consumer and producer surpluses and the resulting deadweight loss. It emphasizes the importance of understanding the intercepts of supply and demand functions and the calculation of surpluses in analyzing market outcomes. The video concludes with a call to action, encouraging viewers to share and subscribe for more informative content.
Mindmap
Keywords
💡Supply and Demand Functions
💡Price Ceiling
💡Consumer Surplus
💡Producer Surplus
💡Equilibrium Price and Quantity
💡Intercept
💡Shortage
💡Deadweight Loss
💡Market Inefficiency
💡Total Surplus
Highlights
Introduction of a problem involving supply and demand functions for sandwiches with a given supply function of 500p - 1000 and a demand function of 11000 - 1000p.
Explanation of the concept of a price ceiling, which is the maximum price at which goods can be sold.
Method to find equilibrium price and quantity by equating supply and demand functions before price ceiling imposition.
Calculation of equilibrium price at $8 and quantity at 3000 units using the supply and demand equations.
Description of how to calculate consumer surplus as the area below the demand curve and above the equilibrium price.
Identification of the intercepts of the supply and demand curves to facilitate surplus calculations.
Calculation of consumer surplus before the price ceiling as the area of a triangle with a base of 3000 and height of 3.
Explanation of producer surplus as the area above the supply curve and below the equilibrium price.
Calculation of producer surplus before the price ceiling as the area of a triangle with a base of 6 and height of 3000.
Determination of total surplus as the sum of consumer and producer surplus before the price ceiling imposition.
Imposition of a $4 price ceiling and its impact on the market, leading to a shortage and a change in supply and demand dynamics.
Calculation of the new quantity supplied at the price ceiling of 1000 units when the price is $4.
Analysis of the new consumer surplus after the price ceiling, including the area of a triangle and a rectangle.
Reduction in producer surplus to the area of a triangle formed by the price ceiling and the supply curve.
Introduction of the concept of deadweight loss as a result of market inefficiency due to the price ceiling.
Calculation of deadweight loss as the area of a triangle resulting from the price ceiling's impact on supply and demand equilibrium.
Summary of the changes in consumer and producer surplus and the introduction of deadweight loss due to the price ceiling.
Emphasis on the importance of understanding the intercepts of supply and demand functions for accurate surplus calculations.
Transcripts
Browse More Related Video
Consumers 'surplus Producers' Surplus , Total surplus, deadweight loss with price floor
Animation on How to Price Ceilings with Calculations

Rent control and deadweight loss | Microeconomics | Khan Academy
Price Ceiling: Consumer Surplus, Producer Surplus, & Deadweight loss

What is Consumers Surplus and Producer Surplus?

Price floors and surplus
5.0 / 5 (0 votes)
Thanks for rating: