9. Supply and Demand & Consumer/Producer Surplus
TLDRIn this lecture, Jonathan Gruber revisits the foundational concepts of supply and demand, explaining their origins and effects when shocked. He delves into the dynamics of market equilibrium, the impact of shifts in supply and demand curves, and introduces welfare economics, focusing on consumer and producer surplus. Gruber illustrates these concepts with real-world examples, including the effects of changing tastes and input costs, and discusses the implications for market efficiency and firm profits.
Takeaways
- 📚 The lecture revisits the supply and demand framework introduced earlier, focusing on understanding the implications of shifts in these curves.
- 📈 The supply curve is upward sloping, indicating that higher prices lead to more supply, while the demand curve is downward sloping, reflecting less demand at higher prices.
- 🔄 Shifts in the demand curve can occur due to changes in tastes, income, prices of complementary or substitutable goods, market size, and expectations of the future.
- 🛑 A shift in the supply curve, such as due to a war in the Middle East affecting oil prices, results in higher production costs and an upward shift in the supply curve.
- 💡 Equilibrium is where the consumers' willingness to pay meets the suppliers' willingness to supply, and changes in this equilibrium can be analyzed through shifts and movements along the curves.
- 🚗 An example given is the increase in demand for gasoline due to a rise in popularity of SUVs, which are complements to gasoline.
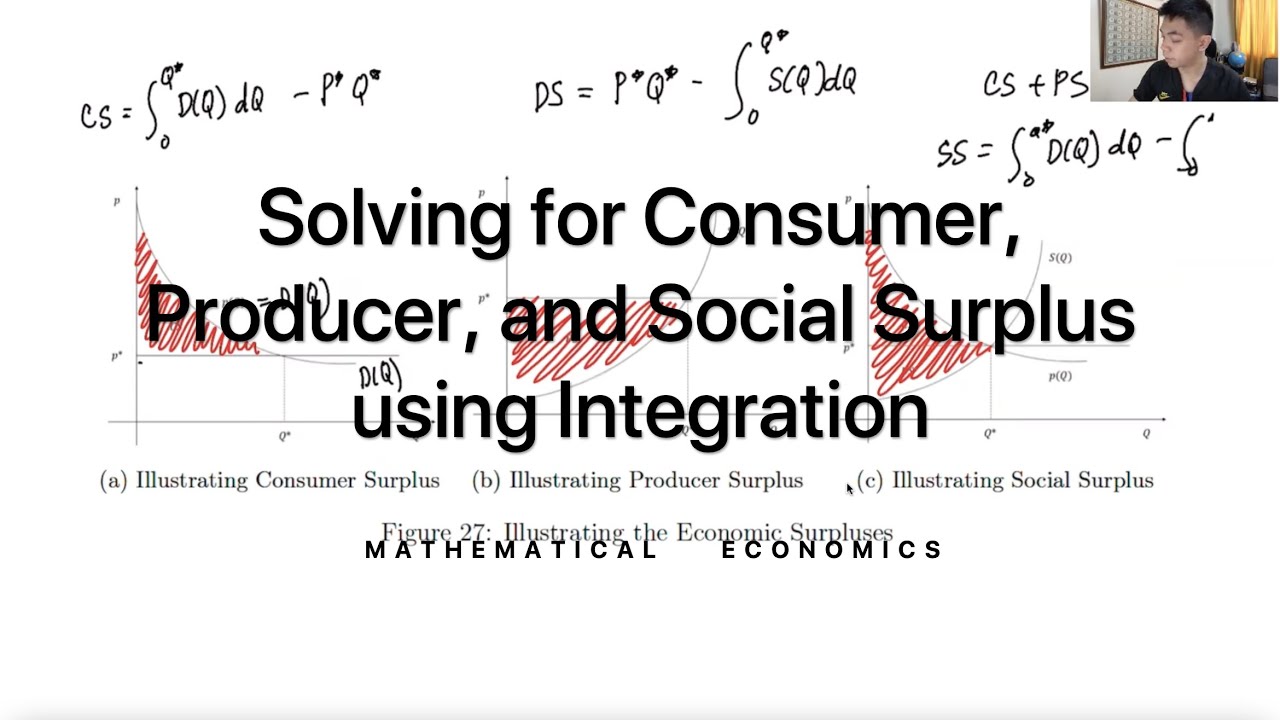
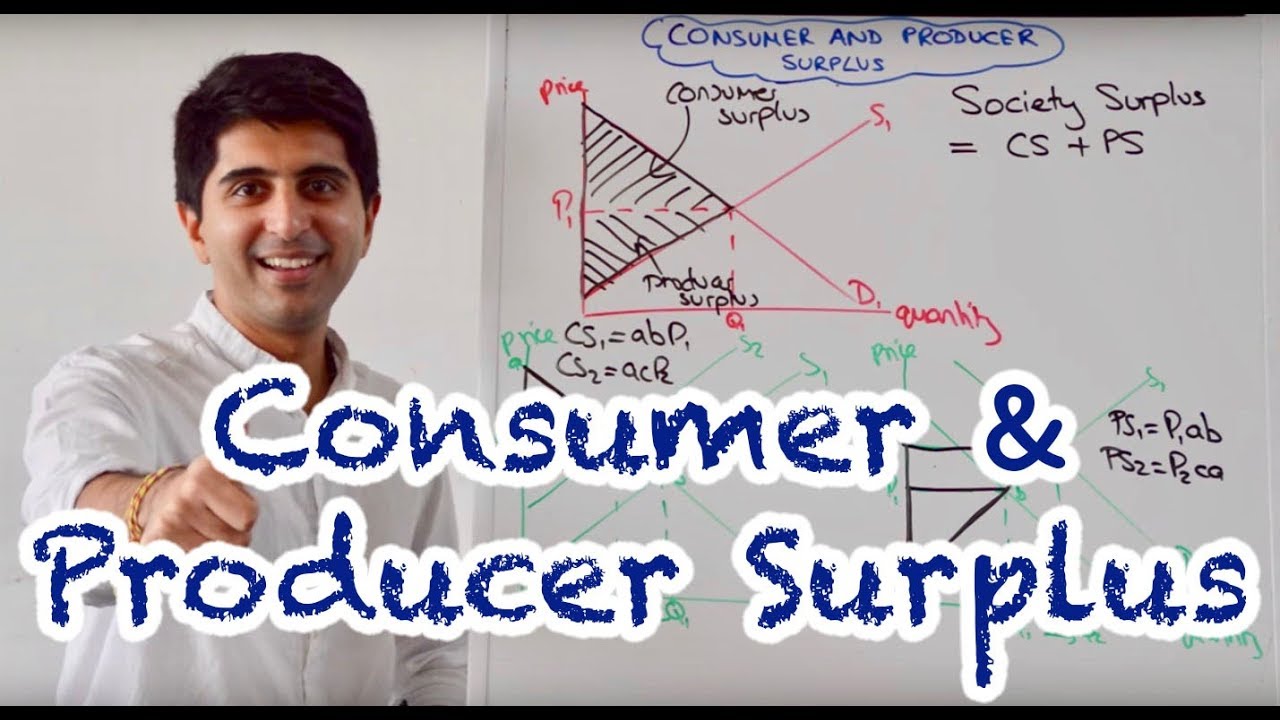
- 💰 The concept of consumer surplus is introduced as the benefit consumers receive from consuming a good, above and beyond what they paid for it.
- 🤔 The script discusses the challenges of measuring well-being or utility, and how economists use the concept of compensating variation to assess consumer surplus.
- 🎁 It highlights the 'Deadweight Loss of Christmas' concept, which suggests that gift-giving can be economically inefficient compared to giving cash.
- 💡 The difference between individual consumer surplus and market consumer surplus is explained, with the latter being the focus for analysis in the course.
- 📊 The importance of the shape of the demand curve in determining the size of consumer surplus is discussed, with more inelastic demand leading to greater surplus.
Q & A
What is the main topic of the lecture?
-The main topic of the lecture is the supply and demand framework, including the concepts of consumer and producer surplus, and how they are affected by changes in market conditions.
What does the supply curve represent?
-The supply curve represents the relationship between the price of a good and the quantity that producers are willing to supply. It is typically upward sloping, indicating that higher prices elicit more supply.
What does the demand curve represent?
-The demand curve represents the relationship between the price of a good and the quantity that consumers are willing to purchase. It is typically downward sloping, indicating that higher prices result in less demand.
What is equilibrium in the context of supply and demand?
-Equilibrium is the point where the supply and demand curves intersect, indicating the market-clearing price and quantity where the amount consumers are willing to buy equals the amount producers are willing to sell.
What is consumer surplus and how is it measured?
-Consumer surplus is the difference between how much consumers are willing to pay for a good and how much they actually pay. It is measured as the area below the demand curve and above the market price.
What is producer surplus and how is it measured?
-Producer surplus is the difference between the market price and the minimum price producers are willing to accept for a good. It is measured as the area below the market price and above the supply curve.
What are some factors that can cause the demand curve to shift?
-Factors that can cause the demand curve to shift include changes in tastes, income levels, the price of complementary or substitutable goods, changes in market size, and expectations of future price changes.
What are some factors that can cause the supply curve to shift?
-Factors that can cause the supply curve to shift include changes in input costs and changes in technology or production methods.
What is the difference between short-run and long-run elasticity of demand for a product like gasoline?
-In the short run, the demand for gasoline is relatively inelastic because consumers have limited alternatives and may still need to drive. In the long run, demand becomes more elastic as consumers can make adjustments such as buying more fuel-efficient cars.
How does an increase in price affect consumer surplus?
-An increase in price reduces consumer surplus by decreasing the difference between the market price and the willingness to pay for each unit of the good. The exact loss is represented by the area of a trapezoid formed by the new price and the original demand curve.
What is the relationship between the shapes of supply and demand curves and the response to market shocks?
-The more elastic the demand curve, the more a price shock will result in a change in quantity rather than price, and vice versa for inelastic demand. Similarly, the shape of the supply curve determines how cost shocks are reflected in market prices and quantities.
Why can't producers exploit the consumer surplus in a perfectly competitive market?
-In a perfectly competitive market, producers can't exploit consumer surplus because they are price takers, not price setters. They must accept the market price and cannot charge consumers more than their willingness to pay.
What is the economic concept behind the idea that gift-giving is inefficient compared to giving cash?
-The concept is based on consumer surplus. Giving cash allows individuals to purchase what they value most, maximizing their surplus. Gifts may not align with the recipient's preferences, potentially offering less surplus than cash.
How does the presence of heterogeneous firms affect the market supply curve and producer surplus?
-When firms have different levels of production efficiency, the market supply curve can be upward sloping. More efficient firms earn greater surplus (profits), while less efficient firms earn less, leading to a distribution of surplus across the market.
What are the implications of an upward-sloping long-run supply curve for producer surplus and market outcomes?
-An upward-sloping long-run supply curve implies that there are conditions such as heterogeneous firms, barriers to entry, or increasing input costs that prevent the market from driving all firms to zero profit. This results in a positive producer surplus and potentially higher prices for consumers.
Outlines
📚 Introduction to Supply and Demand Review
Jonathan Gruber begins the lecture by revisiting the foundational concepts of supply and demand introduced in the first lecture. He emphasizes the importance of understanding the origins of supply and demand curves and their role in determining market equilibrium. Gruber uses the market for gasoline as an example, explaining how the supply curve slopes upward due to higher prices incentivizing more supply, and the demand curve slopes downward as higher prices lead to less demand. The lecture aims to explore the implications of shifts in these curves and their impact on market outcomes.
🚀 Shocking Supply and Demand Curves
Gruber delves into the dynamics of how supply and demand curves are 'shocked' or shifted by various factors. Using the gasoline market as a reference, he illustrates how changes in consumer tastes, such as a preference for SUVs which consume more fuel, can shift the demand curve outward, leading to an increase in both the quantity of gasoline sold and its price. He explains the concept of equilibrium as the point where consumers' willingness to pay meets suppliers' willingness to supply. Gruber also discusses the effects of a hypothetical war in the Middle East on gasoline supply, highlighting how increased costs for oil would shift the supply curve upward, necessitating higher prices for producers to break even.
🔍 Analyzing Shifts in Supply and Demand
The lecture continues with an in-depth analysis of the reasons behind shifts in supply and demand curves. Gruber outlines six factors that can cause demand curves to shift, including changes in tastes, income levels, prices of complementary or substitutable goods, market size, and expectations of the future. On the supply side, he identifies changes in input costs and shifts in technology or production functions as the primary reasons for supply curve shifts. Gruber also uses the example of Kim Kardashian's influence on exercise corset demand to demonstrate how market dynamics respond to demand shocks.
🤔 The Role of Elasticity in Supply and Demand
Gruber discusses the impact of elasticity on supply and demand curves, explaining how the shape of these curves influences the market's response to shocks. He contrasts perfectly inelastic and perfectly elastic demand scenarios, illustrating how in the case of inelastic demand, such as insulin, a supply shock results in little change in quantity but significant price increases. Conversely, with elastic demand, a supply shock leads to quantity changes with little effect on price. The lecture also touches on the long-term versus short-term elasticity of demand for gasoline, highlighting consumers' ability to adapt to price changes over time.
🛍️ Transitioning to Welfare Economics
The lecture takes a turn towards welfare economics, moving from positive economics, which describes 'is', to normative economics, which prescribes 'ought to be'. Gruber introduces the concept of consumer surplus as a measure of welfare, defined as the difference between what consumers are willing to pay and what they actually pay for a good. He explains the compensating variation approach to measuring well-being, which involves assessing how much consumers would be willing to pay for additional utility or to avoid a loss in utility. The lecture sets the stage for a deeper exploration of welfare economics in subsequent sessions.
🎁 Consumer Surplus and the Paradox of Gift-Giving
Gruber explores the concept of consumer surplus further, using the example of gift-giving during Christmas to illustrate the potential inefficiencies of this tradition. He argues that while gifts may carry emotional value, from an economic standpoint, cash gifts would provide recipients with greater consumer surplus, as they could use the cash to purchase goods they value more highly. The lecture also addresses the impact of price changes on consumer surplus, demonstrating how an increase in price reduces the surplus by creating a gap between the original and new price points.
📉 The Dynamics of Consumer Surplus and Price Changes
This section of the lecture examines the specific effects of price changes on consumer surplus. Gruber explains that when the price of a good like gasoline increases, consumer surplus decreases due to two main factors: the loss of surplus for those who stop buying the good because it's no longer worth the higher price, and the reduced surplus for those who continue to buy but at a higher cost. The summary clarifies that the loss in consumer surplus is represented by a trapezoid, reflecting the combined impact of reduced quantity purchased and increased price for the same quantity.
💰 Introducing Producer Surplus and Profits
Gruber introduces the concept of producer surplus, which is analogous to consumer surplus but from the perspective of sellers. He explains that producer surplus is the difference between the price received for a good and the marginal cost of producing it. The lecture illustrates how producer surplus can be thought of as profits in the long run, especially when the supply curve is upward sloping due to factors like heterogeneous firms, barriers to entry, or rising input costs. Gruber emphasizes that producer surplus is a key component of welfare economics and provides insight into the distribution of benefits in a market.
📈 Long-Run Supply Curves and Producer Surplus
The final paragraph of the lecture discusses the conditions under which long-run supply curves may slope upward, leading to producer surplus. Gruber explains that this can occur due to differences in firm efficiency, barriers to entry, or increasing input costs. He distinguishes between situations where an upward-sloping supply curve indicates profits and those where it reflects rising input costs without necessarily implying profits for the firm. The lecture concludes with a note on the importance of understanding these dynamics for a comprehensive view of market economics.
Mindmap
Keywords
💡Supply and Demand
💡Equilibrium
💡Willingness to Pay
💡Willingness to Supply
💡Shifts vs. Movements Along Curves
💡Substitution Effect
💡Consumer Surplus
💡Producer Surplus
💡Elasticity of Demand
💡Perfectly Elastic Demand
💡Perfectly Inelastic Demand
Highlights
Introduction to the concept of 'shocking' supply and demand curves, which refers to external factors that shift these curves.
Explanation of the supply and demand framework, including the determinants of supply and demand curves.
Discussion on how higher prices lead to more supply due to the ability of firms to move up the marginal cost curve.
Clarification that the demand curve represents the willingness to pay and the supply curve represents the willingness to supply.
Analysis of how changes in consumer tastes, such as a preference for SUVs, can shift the demand curve for gasoline.
Dynamics of market adjustment to shifts in demand, leading to changes in quantity and price.
Example of a supply shock, such as a war in the Middle East, affecting the cost of oil and consequently the price of gasoline.
Differentiation between shifts in demand or supply and movements along the curves in terms of market equilibrium.
The role of expectations in influencing demand, such as the anticipation of future price changes.
Identification of factors that cause shifts in demand curves, including changes in tastes, income, and prices of related goods.
Explanation of the limited information provided by a price increase alone, without knowledge of quantity changes.
Discussion on the determinants of supply curve shifts, focusing on changes in input costs and production technology.
Illustration of the impact of social media, such as Kim Kardashian's tweet, on the demand for a product.
Transition from positive to normative economics, introducing the concept of welfare economics.
Introduction of consumer surplus as a measure of welfare, defined as the benefit beyond the price paid for a good.
Explanation of the compensating variation concept as a method to measure well-being indirectly.
Analysis of the impact of price changes on consumer surplus, demonstrating the loss of surplus as a trapezoid.
Discussion on the relationship between the elasticity of demand and the size of consumer surplus.
Introduction of producer surplus as the difference between the price received and the willingness to supply.
Link between producer surplus, profits, and the conditions under which a market supply curve may slope upwards.
Transcripts
Browse More Related Video


5.0 / 5 (0 votes)
Thanks for rating: