Scales of Measurement
TLDRThis video tutorial delves into the crucial concept of scales of measurement in statistical analysis. It defines and illustrates the four basic scales: nominal, ordinal, interval, and ratio, with examples for each. The hierarchy of these scales is outlined, and their application in statistical software like SPSS is discussed. The video concludes with a guide on aligning statistical tests with appropriate scales, emphasizing the importance of understanding scales for effective research.
Takeaways
- 📊 Understanding scales of measurement is crucial for statistical analysis, aiding in the interpretation of statistical outputs.
- 🔢 There are four fundamental scales of measurement: nominal, ordinal, interval, and ratio, each with distinct characteristics and applications.
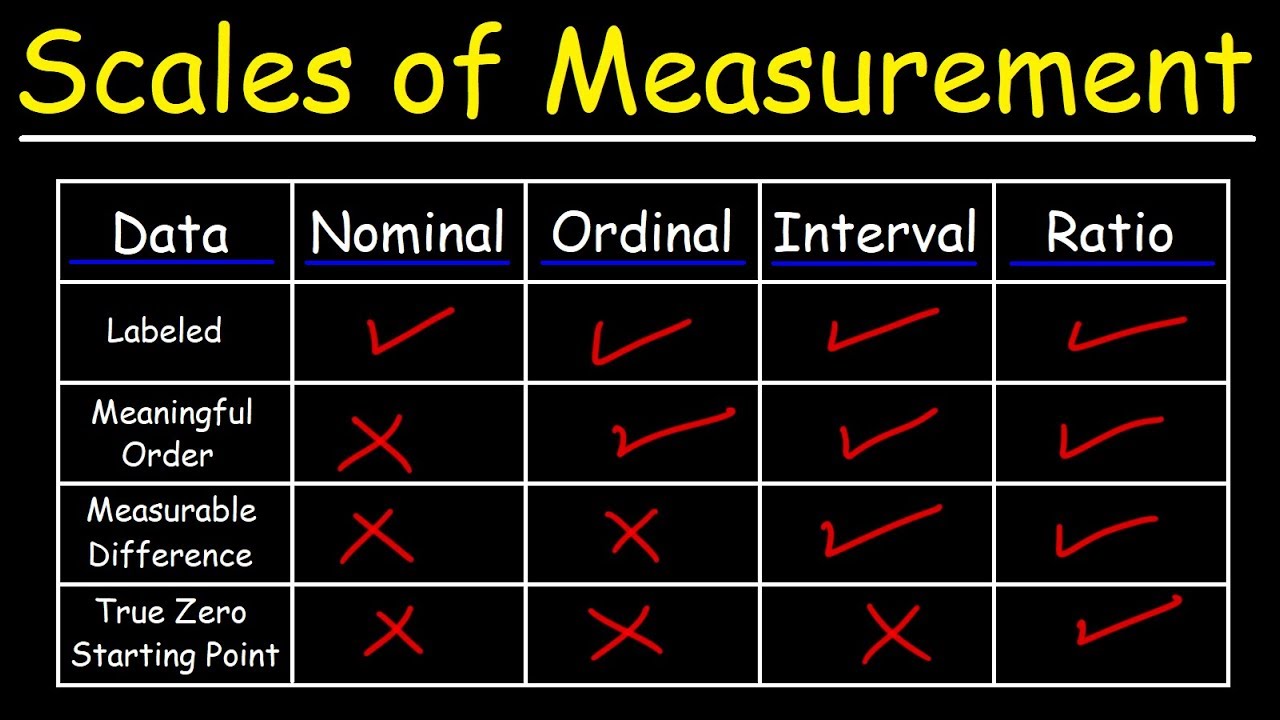
- 🏷 Nominal scales are used for naming or categorizing variables, such as color or gender, without implying any order.
- 📊 Ordinal scales introduce an order to the categories, like a Likert scale, but the intervals between values are not necessarily equal.
- ℹ️ Interval scales have equal intervals between values, like temperature in degrees Fahrenheit, but they do not have a true zero point.
- 💰 Ratio scales are similar to interval scales but include a true zero, which means you can compare the ratios of values, such as income.
- 🔑 The hierarchy of measurement scales is important, with ratio at the top and nominal at the bottom, indicating the level of data detail and analysis complexity.
- 💻 In statistical software like SPSS, variables are assigned scales of measurement, which affects how they are analyzed and interpreted.
- 🔄 It's important to note that the conceptualization of the researcher determines the appropriate scale of measurement for a variable.
- 📝 A table correlating basic statistical tests with their associated scales of measurement can guide the selection of variables for specific analyses.
- 📚 The script emphasizes the importance of scales of measurement in quantitative research and encourages further study in course texts.
Q & A
What is the main topic of the video script?
-The main topic of the video script is scales of measurement, which is an important concept in statistical analysis.
Why is understanding scales of measurement important for statistical analysis?
-Understanding scales of measurement is important because it aids in running statistical analyses, interpreting the output, and choosing the appropriate statistical tests.
How many basic scales of measurement are there, and what are they?
-There are four basic scales of measurement: nominal, ordinal, interval, and ratio.
What is a nominal variable and how is it represented in data?
-A nominal variable is a naming variable with distinct categories, such as color with levels like red, green, and blue. It is represented with numerical codes for identification, but these codes are not intended for mathematical calculations.
What is the key concept in nominal variables that makes them mutually exclusive and exhaustive?
-The key concept is that each unit of analysis in the study can only belong to one group, ensuring that all possible categories are covered without overlap.
How does an ordinal scale differ from a nominal scale?
-An ordinal scale, in addition to being mutually exclusive and exhaustive, adds the requirement of ordered attributes, allowing for ranking, but not for precise mathematical calculations of differences between ranks.
What is the main characteristic of an interval scale of measurement?
-The main characteristic of an interval scale is that it has equal and meaningful distances between values, but it does not have a true zero value, like temperature in degrees Fahrenheit.
What is the key feature of a ratio scale of measurement that distinguishes it from an interval scale?
-The key feature of a ratio scale is that it contains a true zero value, which indicates the absence of the attribute being measured.
How does SPSS represent different scales of measurement in its Variable View?
-In SPSS, nominal scales are indicated by colored circles, ordinal scales by a colored bar graph, and interval and ratio scales are both represented as 'scale' variables with a lined ruler icon.
Why is it important to correctly assign the scale of measurement in SPSS?
-Correctly assigning the scale of measurement in SPSS is important because it determines the type of statistical analyses that can be performed and the interpretation of the results.
What does the provided table in the script do, and how can it help in statistical analysis?
-The table identifies basic statistical tests and their associated scales of measurement, helping users decide which variables to use for specific analyses and ensuring the correct application of statistical methods.
Outlines
📊 Introduction to Scales of Measurement
This paragraph introduces the concept of scales of measurement, emphasizing its importance in statistical analysis. It outlines the four basic scales: nominal, ordinal, interval, and ratio, and mentions the necessity of understanding these scales for proper statistical analysis and interpretation. The video aims to define key attributes of each scale, provide examples, discuss the hierarchy, and explain how these scales are applied in statistical packages like SPSS. The paragraph also touches on the idea of variables in quantitative research and how the scale of measurement is a fundamental attribute of these variables.
🔢 Understanding Nominal and Ordinal Scales
The second paragraph delves into the specifics of nominal and ordinal scales. Nominal scales are used for categorization without any inherent order, exemplified by color preferences or gender. It explains that nominal variables are mutually exclusive and exhaustive, with numerical codes for identification rather than mathematical operations. Ordinal scales, on the other hand, add an order to the categories, allowing for ranking but not precise measurement of differences between levels. The paragraph illustrates this with survey rating scales, highlighting the subjective nature of these scales and their potential for basic mathematical computations.
⏱️ Exploring Interval and Ratio Scales
This paragraph discusses the interval and ratio scales of measurement. Interval scales have ordered attributes with equal intervals between values but lack a true zero point, as exemplified by temperature in Fahrenheit. Ratio scales are the most informative, with all the attributes of interval scales plus a true zero value, allowing for meaningful ratios. The paragraph provides the example of income measured in US dollars to illustrate the concept of ratio scales. It also revisits the hierarchy of scales, from the detailed information provided by ratio scales to the basic identification provided by nominal scales, and discusses how these scales are represented in SPSS, including the importance of researcher intent in determining the scale of measurement.
📈 Applying Scales of Measurement in SPSS and Statistical Analysis
The final paragraph focuses on the application of scales of measurement in SPSS and statistical analysis. It describes how variables and their scales are assigned in SPSS, using visual indicators like colored circles for nominal scales and a lined ruler for scale level variables. The paragraph also discusses the importance of correctly conceptualizing variables according to the researcher's intent. A table is introduced to align basic statistical tests with their appropriate scales of measurement, serving as a guide for selecting variables for analysis. The video concludes with a reminder of the importance of understanding scales of measurement for anyone beginning their journey in statistics.
Mindmap
Keywords
💡Scales of Measurement
💡Nominal
💡Ordinal
💡Interval
💡Ratio
💡Variables
💡Statistical Analysis
💡Hierarchy of Measurement Scales
💡SPSS
💡Mutually Exclusive
💡Exhaustive
💡True Zero Value
Highlights
Scales of measurement are crucial for understanding statistical analysis procedures.
Four basic scales of measurement are nominal, ordinal, interval, and ratio.
Nominal variables
Transcripts
Browse More Related Video

Introduction to Statistics: Levels of Measurement
Scales of Measurement - Nominal, Ordinal, Interval, Ratio (Part 2) - Introductory Statistics

Scales of Measurement: Nominal, Ordinal, Interval and Ratio Scale
Scales of Measurement - Nominal, Ordinal, Interval, & Ratio Scale Data

Scales of Measurement - Nominal, Ordinal, Interval, Ratio (Part 1) - Introductory Statistics

Nominal, Ordinal, Interval & Ratio Data: Simple Explanation With Examples
5.0 / 5 (0 votes)
Thanks for rating: