Scales of Measurement: Nominal, Ordinal, Interval and Ratio Scale
TLDRIn this educational video, Professor Matthias Berto from the University of Applied Science introduces the concept of scales of measurement in statistics. Using the example of an apple, he explains the four levels: nominal, ordinal, interval, and ratio scales, illustrating how each scale allows different types of comparisons and mathematical operations. The video aims to help viewers understand the importance of selecting the appropriate statistical method based on the scale of the data set.
Takeaways
- 📚 The video is a tutorial on statistics by Professor Matthias Berto, focusing on scales of measure or levels of measurement.
- 🍏 The tutorial uses the example of an apple to explain different attributes and how they can be measured.
- 🔍 Attributes of the apple, such as color, weight, harvest date, and sweetness, are measured against certain attributes and recorded.
- 📊 The data collected is organized into a table to facilitate counting and comparing, which are fundamental to statistics.
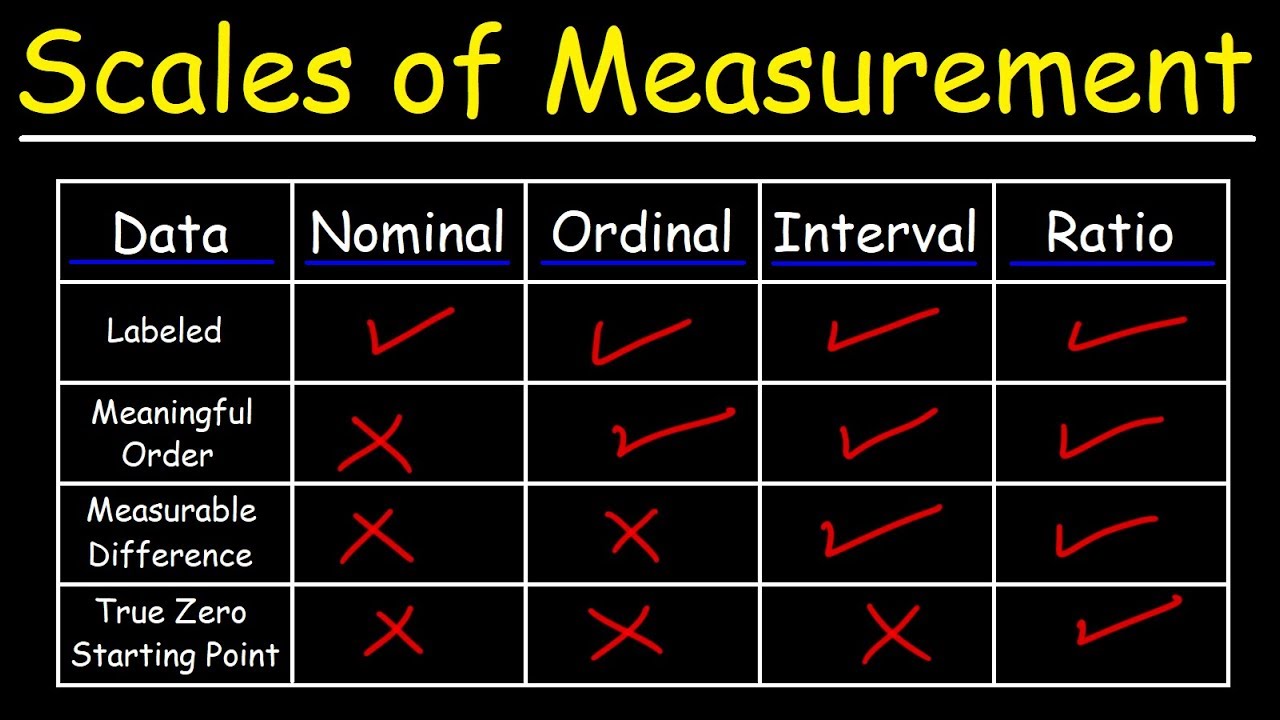
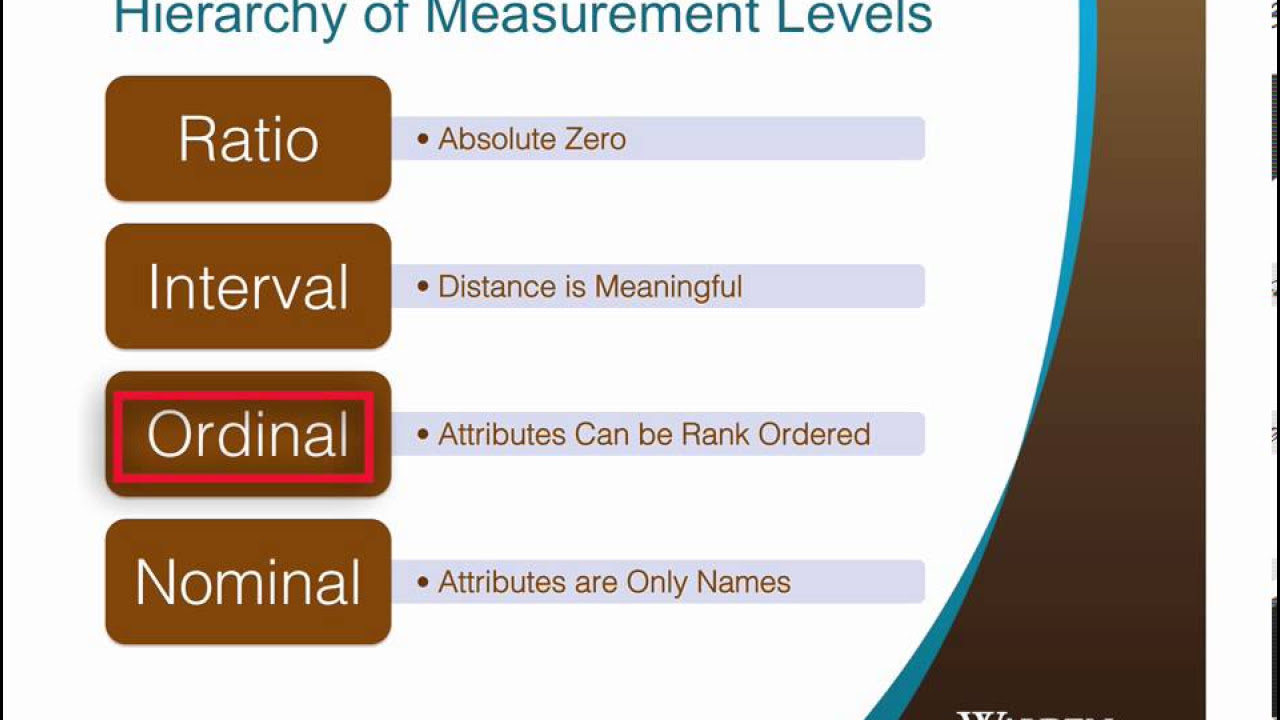
- ⚖️ The scales of measurement are categorized into four levels: nominal, ordinal, interval, and ratio.
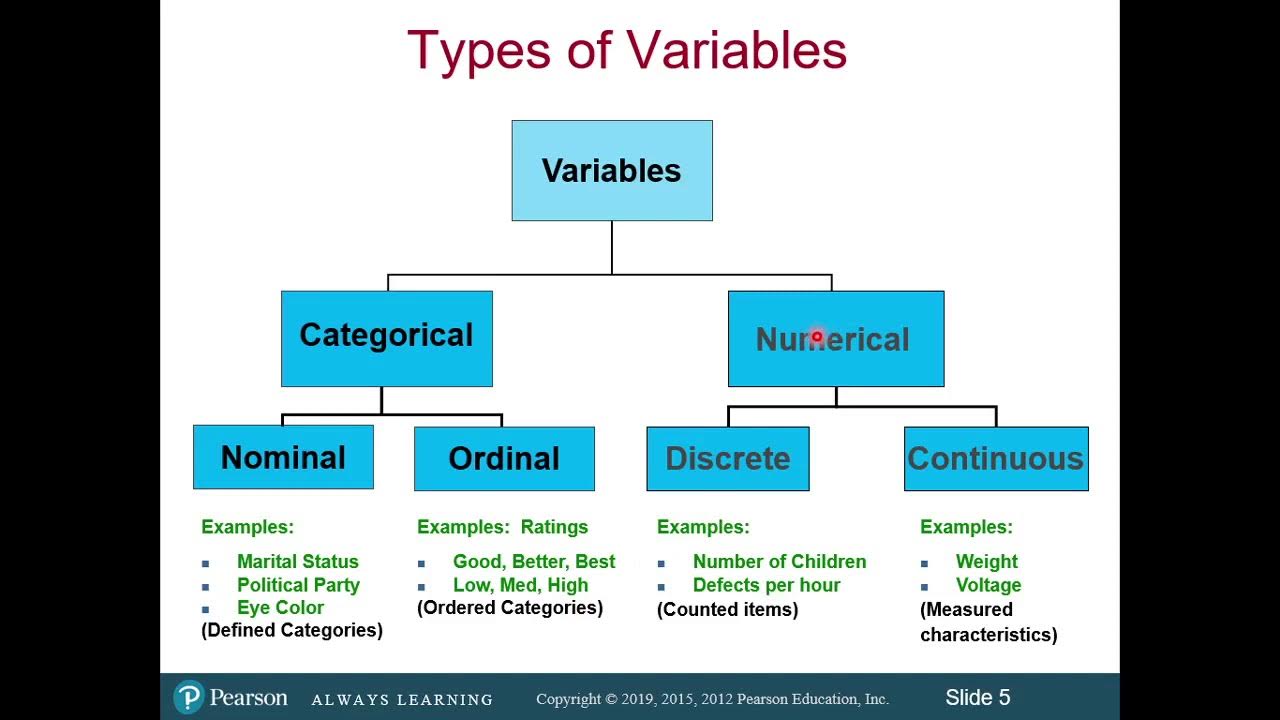
- 🎨 Nominal scale is used for attributes where only same or different comparisons are possible, like the color of the apple.
- 📝 Ordinal scale allows for equal or unequal comparisons and ordering, exemplified by the sweetness level of the apple.
- 📅 Interval scale not only allows for ordering but also the measurement of the distance between values, like harvest dates.
- 🔢 Ratio scale is the highest level, permitting all types of comparisons including the calculation of ratios, as seen with the apple's weight.
- 🔑 Understanding scales of measurement is crucial for selecting appropriate statistical methods that match the data's mathematical operations.
- 🛠 The analogy of using the right tool for the job emphasizes the importance of matching statistical methods to the scale of measurement.
- 👍 The video encourages viewers to subscribe for more educational content and provides a link to a related video on basic statistical terms.
Q & A
What is the main topic of the video by Matthias Berto?
-The main topic of the video is the explanation of scales of measure, also known as levels of measurement, in the context of statistics.
Who is Matthias Berto and what is his profession?
-Matthias Berto is a professor for mathematics and statistics at the University of Applied Science.
What is an example used by Matthias Berto to explain the concept of levels of measurement?
-Matthias Berto uses the example of different apples with varying attributes such as color, weight, harvest date, and sweetness to explain the concept of levels of measurement.
What are the four attributes of the apples that were measured in the video?
-The four attributes measured are color, weight, harvest date, and sweetness.
What is the first level of measurement called and what does it allow?
-The first level of measurement is called the nominal scale, which allows only for the comparison of whether two values are the same or not.
What is the second level of measurement and an example of it from the video?
-The second level of measurement is the ordinal scale, and an example from the video is the attribute of sweetness, which allows for comparisons of equality, inequality, and ordering.
What is the third level of measurement and what additional comparison does it allow?
-The third level of measurement is the interval scale, which, in addition to equal and unequal comparisons and ordering, allows for the determination of the distance between values.
What is the highest level of measurement and what does it enable?
-The highest level of measurement is the ratio scale, which, in addition to all the comparisons of the other scales, enables the calculation of ratios between values.
Why is it important to understand the different scales of measurement in statistics?
-Understanding different scales of measurement is important because it determines the appropriate statistical methods that can be applied to a given dataset, ensuring the mathematical operations required by the method are suitable for the scale of the data.
What does Matthias Berto suggest is the analogy for choosing the wrong statistical method for a given dataset?
-Matthias Berto suggests that using the wrong statistical method for a given dataset is like trying to put in a screw with a hammer or a nail with a screwdriver, implying that it's not the right tool for the job.
What does the video suggest about the relationship between the scales of measurement and statistical methods?
-The video suggests that the scales of measurement dictate which statistical methods can be used, as different methods require different mathematical operations that are only valid for certain scales.
Outlines
🍏 Introduction to Scales of Measurement
The video script introduces the concept of scales of measurement, also known as levels of measurement, through the example of an apple. Professor Matthias Berto uses the attributes of an apple—such as color, weight, harvest date, and sweetness—to explain how different types of data can be measured and compared. The script highlights the importance of understanding these scales in statistics, as they determine what mathematical operations can be performed on the data.
📊 Exploring the Four Levels of Measurement
This paragraph delves into the specifics of the four levels of measurement: nominal, ordinal, interval, and ratio. The nominal scale is used for categorical data where only equal or not equal comparisons can be made, exemplified by the color of the apple. The ordinal scale allows for ordering, as seen with the apple's sweetness. The interval scale, demonstrated by the harvest dates, permits the measurement of differences between values. Lastly, the ratio scale, applicable to the apple's weight, enables the measurement of absolute magnitudes.
Mindmap
Keywords
💡Scales of Measure
💡Nominal Scale
💡Ordinal Scale
💡Interval Scale
💡Ratio Scale
💡Attributes
💡Statistical Methods
💡Data Collection
💡Comparisons
💡Mathematical Operations
💡Statistical Units
Highlights
Introduction to the scales of measure, also known as levels of measurement, by Professor Matthias Berto.
Statistics' versatility across various subjects like medicine, criminology, and economics.
Explanation of how to perceive and describe an Apple through attributes and measurement.
The importance of understanding basic statistical terms for grasping levels of measurement.
Attributes of an Apple: color, weight, harvest date, and sweetness, as examples of different measurement scales.
Demonstration of data collection through comparing multiple Apples on various attributes.
The use of a table to organize and compare data collected on the Apples.
Differences in operations possible with different types of measured data, such as weight vs. color.
Introduction of the four levels of measurement: nominal, ordinal, interval, and ratio scales.
Definition and example of the nominal scale, where only equal or not equal comparisons are possible.
Explanation of the ordinal scale, allowing for equal or unequal comparisons and ordering.
Description of the interval scale, which includes comparisons of distance between values.
Introduction of the ratio scale, the highest level, allowing for calculations of ratios between values.
Practical examples of each scale: color for nominal, sweetness for ordinal, harvest dates for interval, and weight for ratio.
Importance of scale theory as a foundation of statistics for selecting appropriate statistical methods.
Comparison of characteristics across the scales: equal/unequal, order, distance, and ratios.
The necessity of understanding measurement scales to choose the right statistical method for a given problem.
Encouragement to subscribe for more educational content on statistics.
Transcripts
Browse More Related Video
Scales of Measurement - Nominal, Ordinal, Interval, & Ratio Scale Data

Introduction to Statistics: Levels of Measurement

Scales of Measurement - Nominal, Ordinal, Interval, Ratio (Part 1) - Introductory Statistics
Scales of Measurement
Classification of Variables and Types of Measurement Scales

Nominal, Ordinal, Interval & Ratio Data: Simple Explanation With Examples
5.0 / 5 (0 votes)
Thanks for rating: