What is probability | Expected Values, Frequency Distribution, Complement
TLDRThis script delves into the concept of probability, essential for decision-making in business and life. It explains the basics of probability, including events, outcomes, and their numerical expression. The video illustrates how to calculate probabilities for simple and complex events, introduces the idea of expected values, and discusses experimental probabilities. It also covers probability distributions, complements of events, and the importance of the sum of probabilities equaling one, providing a comprehensive foundation for understanding statistical predictions and outcomes.
Takeaways
- 🧩 Life is full of uncertain events and decisions often require an understanding of probabilities to assess risk.
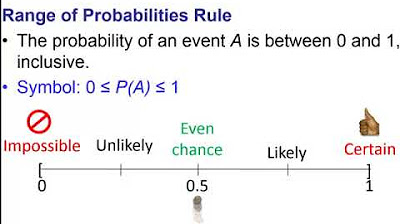
- 📊 Probability is a measure of the likelihood of an event occurring, expressed as a real number between 0 and 1.
- 🎲 An event in probability is a specific outcome or a combination of outcomes, like getting heads in a coin flip.
- 📉 Probabilities are numerically expressed to measure and compare the likelihood of different events.
- 🔢 A probability of '1' indicates certainty of an event occurring, while '0' indicates certainty of it not occurring.
- 🎯 The probability of an event is calculated by dividing the number of favorable outcomes by the total number of possible outcomes.
- 👉 The concept of 'sample space' includes all possible outcomes of an experiment, synonymous with 'favourable outcomes'.
- 🎯 The probability of independent events occurring together is found by multiplying their individual probabilities.
- 🔮 Expected value is used to predict the average outcome of an experiment when repeated many times.
- 📊 Experimental probability is determined through conducting experiments and recording outcomes, which approximates the theoretical probability.
- 📈 Expected values and probability distributions help in making predictions and understanding the likelihood of various outcomes.
Q & A
What is the basic concept of probability?
-Probability is the measure of the likelihood of an event occurring, expressed as a real number between 0 and 1, where 0 indicates the event will not occur and 1 indicates absolute certainty of the event's occurrence.
What is an event in the context of probability?
-An event is a specific outcome or a combination of outcomes in a probabilistic scenario. It can be something like getting heads when flipping a coin or rolling a specific number on a die.
How are probabilities numerically expressed?
-Probabilities are numerically expressed as real numbers between 0 and 1, often in decimal form rather than percentages or fractions, to indicate the likelihood of an event occurring.
What does a probability of '1' signify?
-A probability of '1' signifies absolute certainty that the event will occur.
What is the meaning of a probability of '0'?
-A probability of '0' signifies absolute certainty that the event will not occur.
How is the probability of an event calculated?
-The probability of an event is calculated by dividing the number of favorable outcomes by the total number of possible outcomes.
What is the concept of expected value in probability?
-The expected value of an event is the average outcome we expect to occur if we run an experiment many times. It is calculated by multiplying each outcome by its probability and summing these products.
What is the difference between experimental and theoretical probabilities?
-Experimental probabilities are those derived from conducting experiments and recording outcomes, whereas theoretical probabilities are calculated based on the mathematical understanding of the event and its outcomes.
How do you calculate the probability of the complement of an event?
-The probability of the complement of an event is calculated by subtracting the probability of the event itself from 1.
What is a probability frequency distribution?
-A probability frequency distribution is a representation of the probabilities of each possible outcome in an experiment, often presented in a table or graph, showing how likely each outcome is.
Why is the sum of probabilities of all possible outcomes equal to 1?
-The sum of probabilities of all possible outcomes equals 1 because it represents certainty that one of the outcomes will occur, covering the entire sample space without any overlap.
Outlines
📊 Understanding Probability and Its Applications
The first paragraph introduces the concept of probability, its importance in decision-making, especially for CEOs in business scenarios like R&D investments or mergers. It defines probability as the likelihood of an event occurring and distinguishes between simple and complex events using coin flips and dice rolls as examples. The paragraph also explains how probabilities are numerically expressed, ranging from 0 to 1, with interpretations for these values. It further illustrates the calculation of probabilities by dividing the number of favorable outcomes by the total possible outcomes, using coin flipping and die rolling as examples again.
🎲 Probabilities of Combined Events and Expected Values
This paragraph delves into the probabilities of combined events, such as rolling a die and getting a number divisible by 3, and explains how to calculate these probabilities by considering the number of favorable outcomes over the total outcomes. It introduces the concept of independent events and how their probabilities can be multiplied together. The paragraph then shifts to discuss expected values, which predict the outcome of an event based on repeated trials, and differentiates between experimental and theoretical probabilities. It also explains how to calculate experimental probabilities and expected values for categorical and numerical outcomes, using card drawing and archery as examples.
🏹 Expected Values in Predictions and Complements of Events
The third paragraph continues the discussion on expected values, emphasizing their use in making predictions about future events, often presented as intervals due to inherent uncertainties. It uses weather forecasting as an example to illustrate this point. The paragraph also touches on the concept of numerical outcomes and how to calculate expected values by multiplying each outcome's value by its probability and summing these products. The importance of understanding the most probable outcomes and the use of probability frequency distribution is highlighted, along with an example of rolling two dice and the resulting sums.
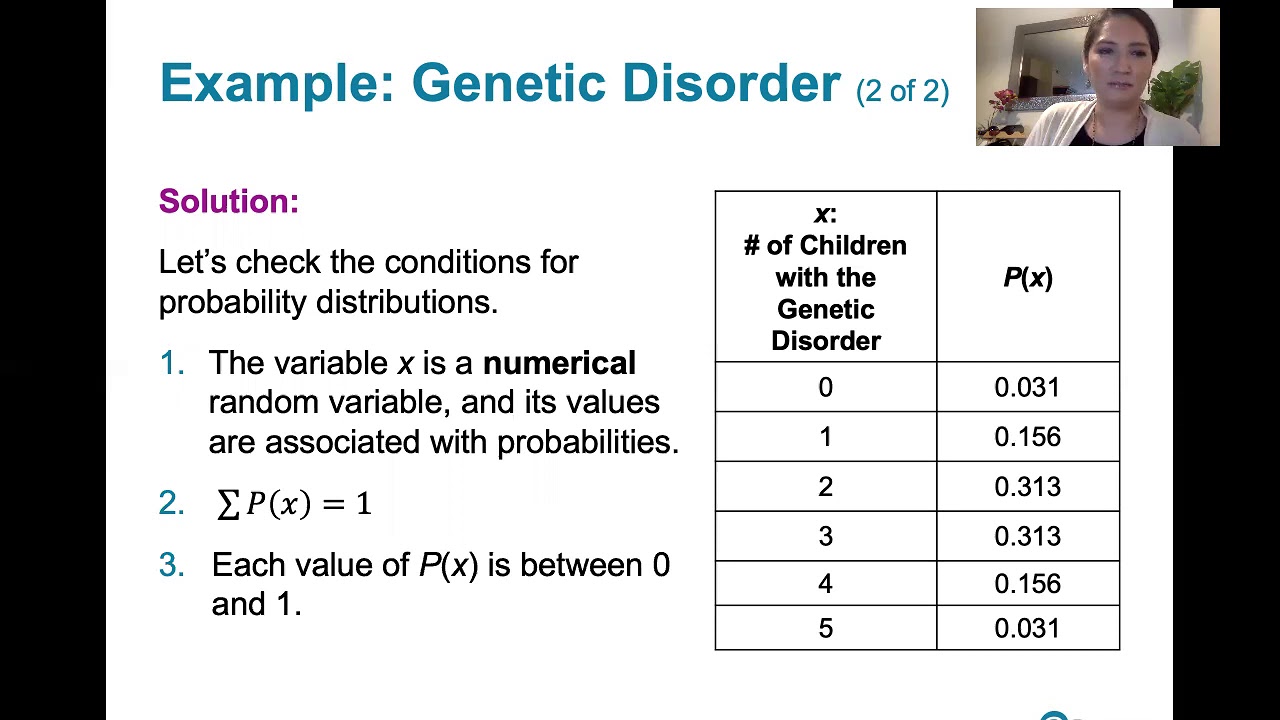
📊 Probability Frequency Distribution and Complements
This paragraph introduces the concept of a probability frequency distribution, which shows the probabilities of each possible outcome for an event. It explains how to construct such a distribution using a table or graph and emphasizes the importance of the expected value in predicting the most likely outcomes. The paragraph also discusses the complement of an event, which represents all outcomes that the event is not, and explains how to calculate the probability of the complement by subtracting the event's probability from 1. It uses the example of rolling a die and getting an even number to illustrate the concept of complements.
🎯 Complements and the Sum of Probabilities
The final paragraph focuses on the characteristics of complements and the sum of probabilities. It explains that the sum of probabilities of all possible outcomes must equal 1, reflecting the certainty of all outcomes occurring. The paragraph discusses the implications of having a sum greater than or less than 1, indicating either double-counting of outcomes or the omission of some outcomes, respectively. It concludes with the concept that the complement of a complement returns to the original event, and uses the example of rolling a die to illustrate how the probability of not getting a certain number is calculated and relates to the sum of probabilities of other outcomes.
Mindmap
Keywords
💡Probability
💡Event
💡Sample Space
💡Favorable Outcomes
💡Experimental Probability
💡Expected Value
💡Complement
💡Independence
💡Frequency Distribution
💡Theoretical Probability
💡Risk Management
Highlights
Life is filled with uncertain events and the importance of considering possible outcomes before making decisions.
CEOs utilize probability and statistical data to make informed decisions in business strategies like R&D investments or mergers.
Probability is defined as the likelihood of an event occurring, with events being specific outcomes or combinations of outcomes.
Flipping a coin exemplifies a simple probability scenario with two possible outcomes: heads or tails.
Probabilities are numerically expressed using real numbers between 0 and 1, with 0 indicating impossibility and 1 indicating certainty.
The concept of 'sample space' represents all possible outcomes of an event.
The probability of an event is calculated as the ratio of preferred outcomes to the total number of possible outcomes.
Example given: the probability of rolling a 4 on a six-sided die is one-sixth, illustrating the calculation of single-outcome probabilities.
Complex events, such as rolling a number divisible by 3 on a die, involve multiple preferred outcomes.
The probability of independent events occurring simultaneously is found by multiplying the probabilities of the individual events.
Expected values are predictions of outcomes based on running an experiment multiple times, contrasting with theoretical probabilities.
Experimental probabilities are approximations derived from conducting experiments, such as estimating coin flip outcomes.
Expected values for categorical outcomes, like drawing a spade from a deck of cards, are calculated using theoretical probabilities.
For numerical outcomes, expected values are calculated by summing the products of each outcome's value and its probability.
Expected values help make predictions about the future based on past data, despite not guaranteeing exact outcomes.
Probability frequency distribution is a method to understand the likelihood of each possible outcome, visualized through graphs or tables.
The concept of 'complement' in probability theory refers to the opposite of an event, completing the rest of the sample space.
The sum of probabilities of all possible outcomes must equal 1, reflecting the certainty of at least one outcome occurring.
The probability of the complement of an event is calculated as 1 minus the probability of the event itself.
Transcripts
5.0 / 5 (0 votes)
Thanks for rating: