Statistics Exam 1 Review Solutions
TLDRThis instructional video covers review problems for a Statistics or Math 1025 class, focusing on exam one. It explains key concepts such as the difference between samples and populations, types of data (qualitative and quantitative), and various sampling techniques (systematic, simple random, stratified, and cluster sampling). The video also demonstrates how to calculate statistics like mode, median, mean, variance, and standard deviation for both samples and populations, using a calculator for accuracy. Additionally, it discusses creating stem and leaf plots and touches on probability concepts involving rolling dice and drawing cards from a deck.
Takeaways
- 📚 The script is a review for a statistics or math 1025 class, focusing on exam one concepts.
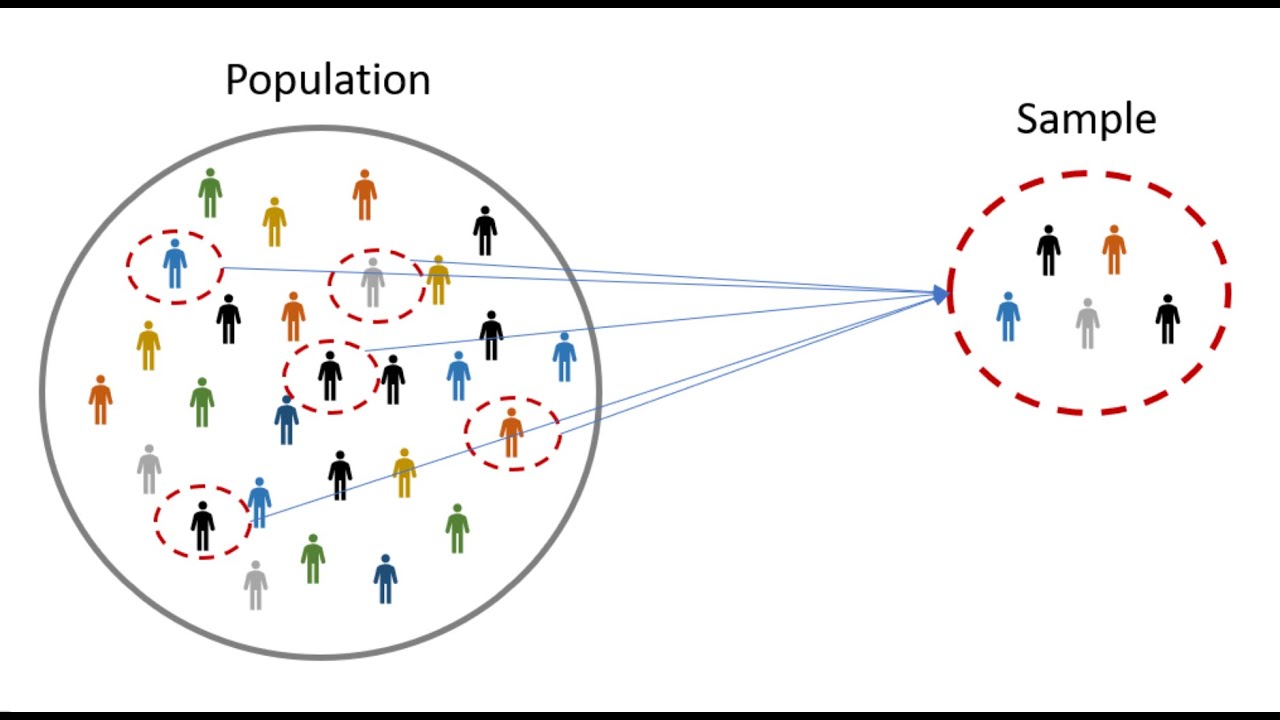
- 🔍 It differentiates between a 'sample' and a 'population', emphasizing the importance of the term 'all' in defining a population.
- 👨🏫 The instructor explains that a survey of a subset of a larger group, like 5,000 US adults, represents a sample and the results are considered statistics.
- 🏫 An example from Century College is used to illustrate the calculation of parameters, assuming all students' data is used.
- 🔢 The script covers the difference between qualitative data (like hair color) and quantitative data (like weight in pounds).
- 🚗 It explains sampling techniques such as systematic sampling, simple random sampling, stratified sampling, and cluster sampling with relevant examples.
- 📈 The process of creating a frequency distribution chart and calculating relative frequency and cumulative frequency is demonstrated.
- 📊 The script helps to understand how to interpret histograms to estimate quantities, like the number of televisions costing $500 or less.
- 📉 Calculations for mode, median, mean, variance, and standard deviation for both sample and population datasets are discussed with examples.
- ⚖️ The importance of showing work for partial credit is highlighted, especially when mistakes are made in calculations.
- 🤔 The script touches on probability calculations involving rolling dice, drawing cards, and selecting committee members, emphasizing different methods to arrive at the same solution.
Q & A
What is the main focus of the video script?
-The video focuses on solving review problems for a statistics or math class, specifically for Exam 1.
How is the concept of 'population' vs. 'sample' explained in the script?
-The script explains that 'all cities in the United States' is considered a population because it includes every city, whereas a survey of a portion, like 10% of the cities, would be a sample.
What example is given to illustrate a sample?
-A survey of 1,000 residents of St. Paul is given as an example of a sample since it includes only part of the entire population of St. Paul.
How is the term 'statistic' defined in the context of the script?
-A statistic is a number that describes a sample, such as the 23% of US adults with brown hair derived from a sample of 5,000 US adults.
What scenario is used to illustrate a parameter?
-The average number of credits taken by students at Century College in fall 2013, calculated by an administrator from all students' data, is given as a parameter.
What distinguishes qualitative data from quantitative data according to the script?
-Qualitative data, like hair color, are categorical and not numerical, whereas quantitative data, like weight in pounds, have numerical values.
What is systematic sampling, as described in the script?
-Systematic sampling involves counting the number of cars traveling across a bridge every sixth Monday for a year, using a regular interval to select the sample.
How is simple random sampling illustrated?
-Simple random sampling is illustrated by an instructor using a computer program to randomly select five students from a class of 30 to determine their study hours.
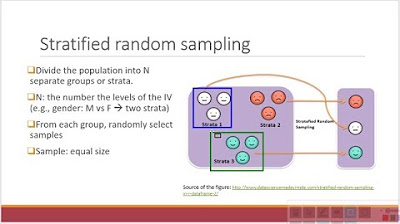
What is stratified sampling?
-Stratified sampling involves dividing a population into groups, such as male and female students, and then taking a sample from each group.
How is cluster sampling described in the script?
-Cluster sampling is described as selecting all students from three out of nine sections of a statistics class to determine the average study hours for an exam.
What method is used to calculate the relative frequency in a frequency distribution chart?
-The relative frequency is calculated by dividing the frequency of each category by the total number of data points.
What is the difference between sample variance and population variance?
-Sample variance divides the sum of squared deviations by (n-1), where n is the sample size, while population variance divides by n.
What statistical measures are calculated in the script?
-The mode, median, mean, variance, and standard deviation for both sample and population data sets are calculated.
What is the purpose of using a calculator's statistical functions in the script?
-The calculator's statistical functions help to streamline the calculations of mean, variance, and standard deviation, reducing the likelihood of errors.
How are stem-and-leaf plots constructed?
-Stem-and-leaf plots are constructed by writing the tens digits (stems) and then listing the ones digits (leaves) for each data point, optionally ordering the leaves for clarity.
What does a negative linear correlation imply about two variables?
-A negative linear correlation implies that as one variable increases, the other variable decreases. For example, as weight increases, heart rate decreases.
How is the probability of rolling a sum of nine with two dice calculated?
-The probability is calculated by counting the number of combinations that sum to nine (3+6, 4+5, 5+4, 6+3) and dividing by the total number of possible combinations (36), resulting in a probability of 4/36 or 1/9.
How do you find the probability of drawing two spades from a deck of cards?
-The probability is found by calculating the chance of drawing the first spade (13/52) and then the second spade (12/51), multiplying the probabilities to get 1/17.
What is the formula for combinations and how is it used in the script?
-The formula for combinations (n choose k) is used to determine the number of ways to choose a subset of items from a larger set where order does not matter, as in selecting 4 days to work out of 7.
What is the difference between permutations and combinations?
-Permutations consider the order of selection, used for problems like selecting a president, vice president, and treasurer, whereas combinations do not consider order, used for selecting days to work.
Outlines
📚 Review Problems for Statistics Class
This paragraph introduces a series of review problems for a statistics or math 1025 class, focusing on exam one. The speaker aims to clarify the concepts of samples and populations using examples such as all cities in the United States, a survey of residents in St. Paul, and a survey of US adults' hair color. The explanation distinguishes between parameters derived from populations and statistics from samples, and also covers qualitative versus quantitative data, introducing the concepts of systematic sampling and simple random sampling.
🔍 Sampling Techniques and Data Analysis
The speaker discusses various sampling techniques, including systematic sampling, stratified sampling, and cluster sampling, with examples to illustrate each method. The paragraph also covers how to determine the mode, median, and mean of a data set, and introduces the concepts of variance and standard deviation for both samples and populations. The speaker makes a mistake in calculating the mean and variance, highlighting the importance of careful calculation and the use of technology to reduce errors.
📉 Data Interpretation and Probability Concepts
This section delves into data interpretation tasks such as creating a frequency distribution chart and understanding relative frequencies. The speaker also explains cumulative frequency and uses a histogram to estimate the number of televisions costing $500 or less. The paragraph further explores the calculation of mode, median, mean, variance, and standard deviation for a given data set, emphasizing the importance of accurate data entry and calculation.
🎲 Probability Calculations and Statistical Analysis
The speaker provides a detailed walkthrough of calculating probabilities in various scenarios, such as rolling dice and drawing cards from a deck. The explanation covers the use of combinations and permutations to determine the number of ways to achieve certain outcomes, and the importance of considering order in certain probability problems. The paragraph also touches on the concept of partial credit and the value of showing work to facilitate understanding and grading.
📊 Stem and Leaf Plots and Correlation Understanding
The speaker introduces the concept of stem and leaf plots for data visualization, demonstrating how to create and interpret these plots. The paragraph also discusses the idea of negative and positive linear correlations, using examples of animal weight and heart rate, and wattage and lumens of light bulbs to illustrate the concepts. The speaker emphasizes the importance of understanding how variables relate to one another in a data set.
📈 Standard Deviation and Probability Revisited
This section revisits the concept of standard deviation, explaining its role as a measure of dispersion in a data set. The speaker uses an example data set to illustrate the calculation of the mean, mode, median, and standard deviation, and discusses the implications of these values. The paragraph also revisits probability, exploring the likelihood of rolling certain sums with two dice and emphasizing the importance of accurate calculation.
🤔 Probability of Card Draws and Combinations
The speaker explores the probabilities of drawing specific cards from a standard deck, calculating the chances of drawing two spades, a spade followed by a heart, and one spade and one heart in any order. The explanation covers different methods of calculation, including combinations and permutations, and discusses the importance of selecting the correct method based on the problem's requirements.
📝 Combinations and Permutations in Selection Problems
The final paragraph discusses the difference between combinations and permutations in the context of selecting a group of individuals for specific roles, such as president, vice president, and treasurer. The speaker emphasizes the importance of understanding when order matters and when it does not, and calculates the number of ways to make selections using both methods, providing a clear conclusion on which method is appropriate for each scenario.
Mindmap
Keywords
💡Population
💡Sample
💡Statistic
💡Parameter
💡Qualitative Data
💡Quantitative Data
💡Systematic Sampling
💡Simple Random Sample
💡Stratified Sample
💡Cluster Sampling
💡Mode
💡Median
💡Mean
💡Variance
💡Standard Deviation
💡Stem and Leaf Plot
💡Correlation
💡Probability
Highlights
Review of statistics concepts for Math 1025 class focusing on exam preparation.
Discussion on the difference between a sample and a population using U.S. cities as an example.
Explanation of why 5,000 U.S. adults survey results represent a statistic, not a parameter.
Analysis of the average number of credits taken by students at Century College as a population parameter.
Qualitative data identified through hair color categorization.
Quantitative data illustrated with the example of weight in pounds.
Systematic sampling technique explained using the example of counting cars on Mondays.
Simple random sample demonstrated through an instructor's selection of students for a study.
Stratified sampling technique discussed with a focus on gender groups in a class.
Cluster sampling described through Century College's study of students across three sections.
Construction of a frequency distribution chart from given data.
Calculation of relative frequency and cumulative frequency from a data set.
Interpretation of a histogram to determine the number of televisions costing $500 or less.
Comprehensive calculation of mode, median, mean, variance, and standard deviation for a data set.
Illustration of stem and leaf plot construction for a given data set.
Correlation analysis between animal weight and heart rate with a negative linear correlation assumption.
Correlation analysis between light bulb wattage and lumens output with a positive linear correlation.
Determination of median and mean from a data set with ones and sixes.
Comparison of standard deviation calculations for sample and population.
Probability calculations involving rolling two dice with various conditions.
Use of combinations and permutations in probability problems, illustrated with card drawing scenarios.
Strategy for verifying probability calculations by using different methods to ensure accuracy.
Calculation of combinations for working 4 days out of a 7-day week.
Selection of club officers from a group of 12 people using permutations.
Transcripts
Browse More Related Video
Research Methods 1: Sampling Techniques

Statistics Lecture 1.5: Sampling Techniques. How to Develop a Random Sample
Statistics: Populations & Samples and Parameters vs Statistics

Chapter 1 - An Intro to Business Statistics

Probability and Non-Probability Sampling in Research Methods
population sample parameter statistic | Gourav Manjrekar
5.0 / 5 (0 votes)
Thanks for rating: