Understanding Statistical Graphs and when to use them
TLDRIn this informative video by Dr. Nick, viewers are introduced to seven distinct types of graphs for data representation. The video elucidates when to use each graph type, highlighting the importance of visualizing data to uncover patterns and communicate findings effectively. Starting with the basic pictograph, the discussion progresses through bar charts, pie charts, dot plots, stem and leaf plots, scatter plots, and time series plots. Each graph type is tailored for specific data characteristics, emphasizing the need for appropriate graph selection to facilitate analysis and comprehension.
Takeaways
- 📊 Graphs are essential for visualizing data and identifying patterns that may not be apparent from numbers alone.
- 🍎 Pictographs use actual objects or pictures to represent data, which is particularly useful for categorical data and answering frequency questions.
- 📊 Bar charts are an alternative to pictographs, representing data through the length or height of bars, making it easy to compare categories.
- 🍰 Pie charts should be reserved for displaying categorical data with five or fewer categories, and they should be kept simple without 3D effects or exploding segments.
- 📈 Dot plots are valuable for numerical data, representing each data point with a dot and providing a clear view of the data distribution.
- 🌿 Stem and leaf plots offer a quick insight into the shape of the data by separating numbers into stems (first digit) and leaves (second digit).
- 🔗 Scatter plots are used to show the relationship between two numerical variables, with each dot representing an observation and no lines connecting them.
- 🗓 Time series plots are a special type of scatter plot that display data over time, showing trends and patterns by connecting data points.
- 📈 The choice of graph should be based on the context and purpose of the investigation, and different graphs may be suitable for the same data set.
- 🛠 Good statistical software can assist in creating appropriate graphs for the data, making the analysis process more efficient and effective.
Q & A
What is the main purpose of using graphs in statistics?
-The main purpose of using graphs in statistics is to visualize patterns and distributions in data, which can be difficult to discern from numbers alone. Graphs help in analyzing data, answering questions, and communicating findings more effectively.
What is a pictograph and how is it used in data representation?
-A pictograph is a simple form of graph that involves lining up actual objects or their pictures in rows according to characteristics. It is used to count instances of a characteristic, such as the type of fruit students bring for a class fruit salad, and to answer questions about the most popular fruit or the comparison between different types.
What are data cards in the context of pictographs?
-Data cards in pictographs are cards that each show the data for one individual person or thing. They help in representing categorical data and can be used to compare different categories, such as the number of dragons that breathe ice versus those that breathe acid fire.
How does a bar chart differ from a pictograph?
-A bar chart represents data by using bars where the length or height corresponds to the frequency or number of times an object occurs. Unlike pictographs, bar charts can be used for both categorical and some numerical data, and they make it easy to compare categories, even when differences are minimal.
What are the conditions for using a pie chart appropriately?
-Pie charts are appropriate when you have five or fewer categories, the data is categorical, and there is no inherent order to the data. Additionally, pie charts should be kept simple, avoiding 3D effects or 'exploding' segments.
What is a dot plot and how does it represent numerical data?
-A dot plot is a graph used for numerical data where each dot represents one data point. It functions like a number line with dots stacked up, showing the distribution of data and allowing for a clear visualization of the data's shape, such as in a plot of heights or the number of pairs of shoes owned by different people.
What is the purpose of a stem and leaf plot and how does it represent data?
-A stem and leaf plot is used for getting a quick idea of the shape of the data. The stem represents the first digit of the number, and the leaf represents the second digit. This type of plot allows for an easy visualization of data distribution, such as grades in a class test.
What is a scatter plot and how does it show relationships between two numerical variables?
-A scatter plot is used to show the relationship between two numerical variables. Each dot in the plot represents one observation, and its position corresponds to the values of the two variables being compared, such as the relationship between the number of pieces in a Lego set and the price, or the weight of an orange and the weight of juice it yields.
How does a time series plot differ from a regular scatter plot?
-A time series plot is a special type of scatter plot where the horizontal axis is in units of time and is equally spaced. It shows data points over time, such as the number of visitors arriving in New Zealand each month from 1980 to 2015. In a time series plot, it is common to join up the dots to visualize repeating patterns or trends over time.
Why might more than one type of graph be appropriate for a given dataset?
-More than one type of graph might be appropriate for a dataset because different graphs serve different purposes and can highlight different aspects of the data. The choice of graph depends on the context and purpose of the investigation, and good statistical packages can help create appropriate graphs for the data.
Outlines
📊 Introduction to Data Graphs
Dr. Nick introduces seven types of graphs used for representing data in a visual format. He emphasizes the importance of graphs in statistics for analyzing and communicating data patterns. The video discusses when to use each graph type and what to consider when presenting data graphically. The first graph type mentioned is the pictograph, which uses objects or pictures to represent categorical data, making it easy to compare quantities and identify the most common categories.
📈 Bar Charts and Pie Charts
The script explains the use of bar charts for displaying categorical and some numerical data, where the length or height of the bars indicates frequency. Bar charts are useful for comparing categories and can be ordered by size for additional insights. Pie charts are then discussed as a way to represent proportions of categories, but they are recommended only for a limited number of categories and when there is no inherent order to the data. Dr. Nick also advises against using 3D effects or 'exploding' segments in pie charts to keep the graph simple and clear.
📊 Dot Plots and Stem and Leaf Plots
Dot plots are introduced as a method for representing numerical data, with each dot signifying a data point. They are likened to number lines with stacked dots, useful for visualizing the distribution shape of data. The script also covers stem and leaf plots, which provide a quick overview of data distribution by separating numbers into stems (first digit) and leaves (second digit). These plots are particularly helpful for understanding the shape of data and are easily created with computer software.
🔗 Scatter Plots and Time Series Plots
Scatter plots are described for illustrating the relationship between two numerical variables, with each dot representing an observation. The script provides examples, such as the relationship between the number of Lego pieces and their price, and between the weight of an orange and the weight of juice it yields. Time series plots, a type of scatter plot, are then explained, showing data points over time with equal spacing on the horizontal axis. These plots are useful for identifying repeating patterns and trends over time.
Mindmap
Keywords
💡Graphical representation
💡Pictograph
💡Bar chart
💡Pie chart
💡Dot plot
💡Stem and leaf plot
💡Scatter plot
💡Time series plot
💡Data distribution
💡Statistical packages
Highlights
Dr. Nick introduces seven different types of graphs for data representation.
Graphs are used to find patterns and answer questions from multiple data points.
Pictographs are the simplest form of graphs using actual or pictured objects lined up in rows.
Pictographs can answer questions about categorical data, such as the most popular fruit.
Data cards in pictographs show data for individual entities, like the number of dragons with different abilities.
Bar charts represent data through bars where length indicates frequency of occurrence.
Bar charts are useful for both categorical and some numerical data, making category comparisons easy.
Pie charts are suitable for displaying proportions of five or fewer categorical categories without an inherent order.
Dot plots are used for numerical data, with each dot representing a single data point.
Dot plots can visualize the distribution shape of data, useful for understanding data spread.
Stem and leaf plots provide a quick overview of data distribution by separating numbers into stems and leaves.
Scatter plots display relationships between two numerical variables through individual observation points.
Time series plots are a type of scatter plot that shows data points over time, often connected to reveal patterns.
The choice of graph depends on the context and purpose of the investigation, with various types being appropriate.
Good statistical packages can create appropriate graphs for data, aiding in analysis and communication.
The video is produced by the Statistics Learning Center, offering resources for statistical learning.
Transcripts
Browse More Related Video

Elementary Statistics - Chapter 2 - Exploring Data with Tables & Graphs
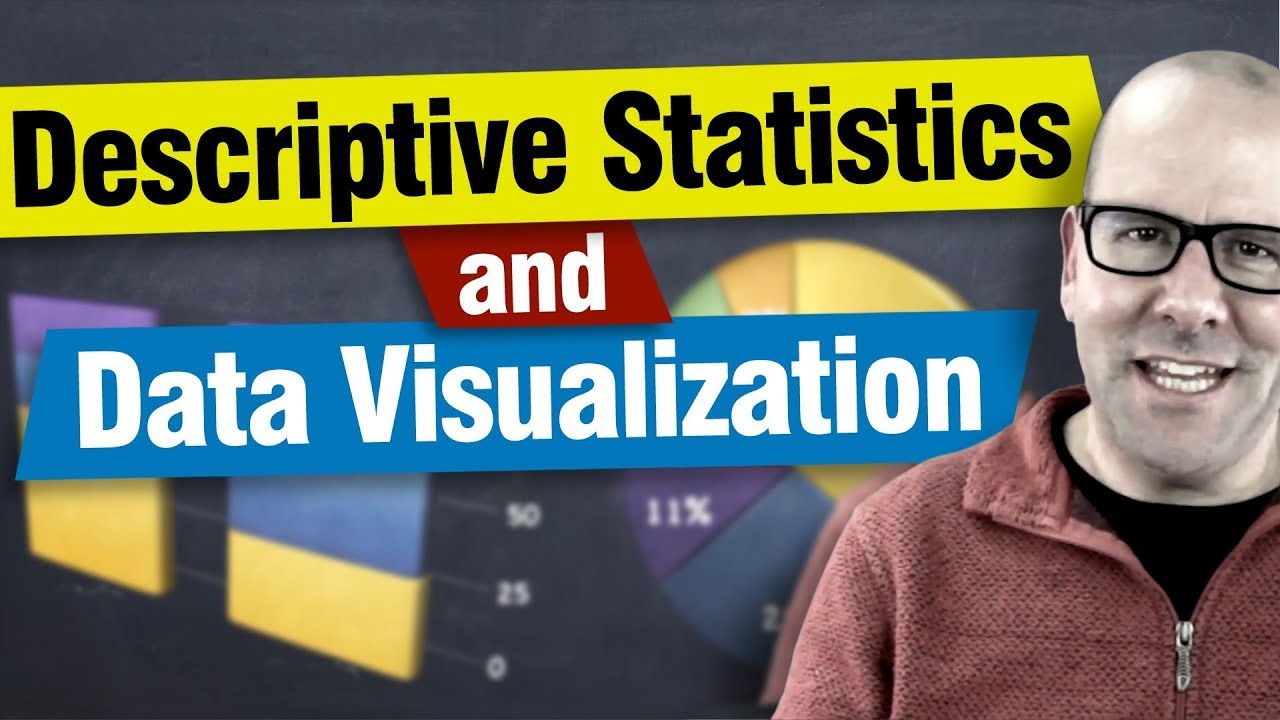
Descriptive statistics and data visualisation. An introduction to statistics and working with data
Math 119 Chapter 2 Part 2
Plots, Outliers, and Justin Timberlake: Data Visualization Part 2: Crash Course Statistics #6

Elementary Stats Lesson 2
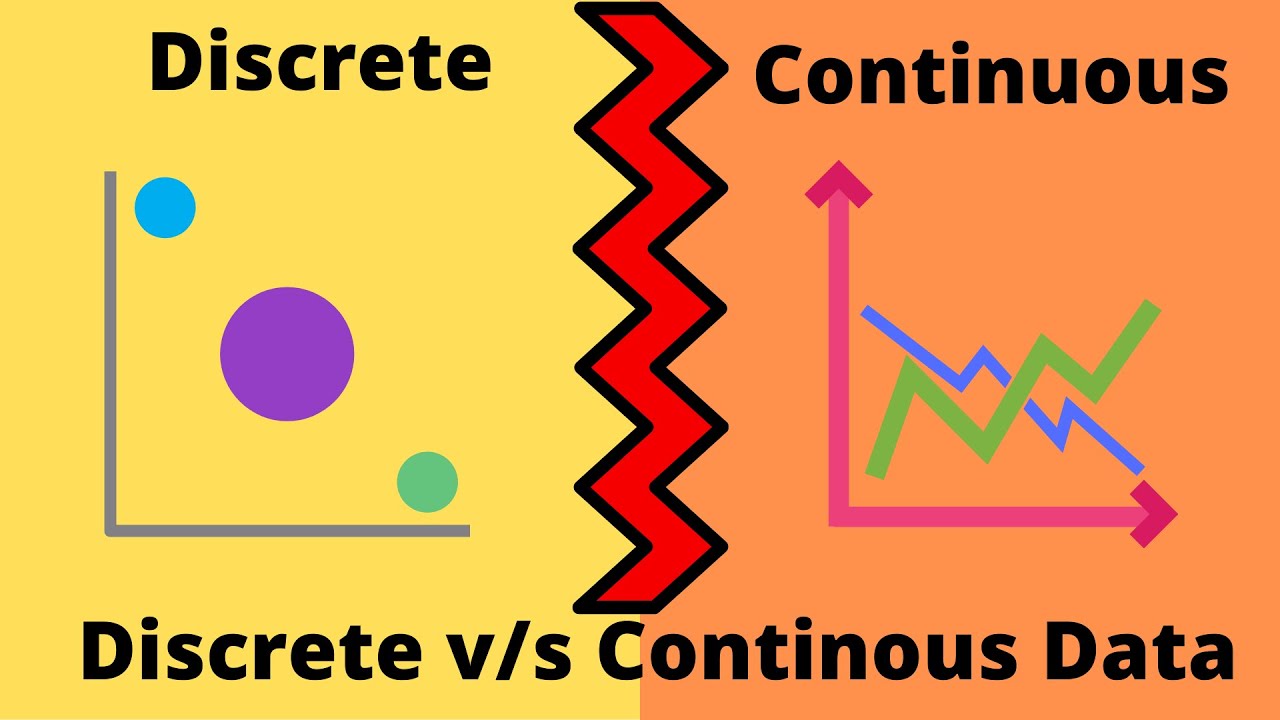
Discrete v/s Continuous Data - What ? How ? || Discrete Data || Continuous Data || Basic Statistics
5.0 / 5 (0 votes)
Thanks for rating: