Calculus - Lesson 14 | Integral of a Function | Don't Memorise
TLDRThis script delves into the concept of integration, explaining how to find the area under a graph by approximating it with rectangles. It introduces the lower and upper sums, which are calculated using the minimum and maximum function values within sub-intervals, respectively. As the number of sub-intervals approaches infinity, both sums converge to the actual area under the graph. The script also explores using any 'y' value within the sub-intervals, demonstrating that the sum of these areas will also approach the true area, leading to the definition of the integral. The integral is not just a sum but the limit of sums, symbolized by an 'S' rather than the summation symbol. The process concludes with the integral's notation, indicating the limits of integration on the x-axis. The script invites viewers to apply this knowledge to find the integral of a given function and hints at the connection between integration and differentiation to be explored in future videos.
Takeaways
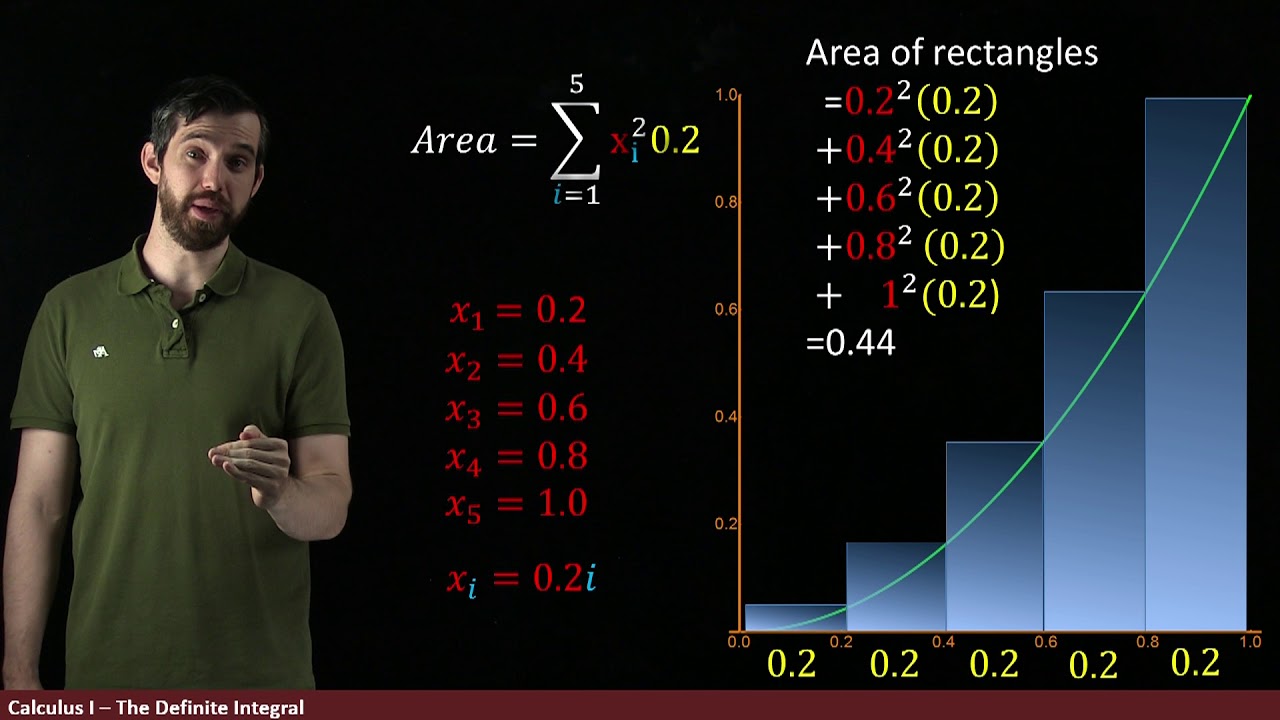
- 📊 The lower sum is calculated by taking the minimum 'y' values in each sub-interval as the heights of rectangles to approximate the area under the graph.
- 📈 The upper sum is found by using the maximum 'y' values in each sub-interval, which results in a sum that is always greater than the actual area under the graph.
- 🔍 As the number of sub-intervals 'n' approaches infinity, both the lower and upper sums converge to the actual area under the graph.
- 📐 The integral of a function can be approximated by taking any 'y' value between the maximum and minimum within each sub-interval, and the sum of these areas will also converge to the area under the graph.
- 🌐 The term 'dx' in the integral symbol represents an infinitesimal width of the rectangles, indicating that as 'n' increases, the rectangles become thinner and the approximation becomes more accurate.
- 📝 The integral symbol with a long 's' signifies the limit of the sums rather than the sum itself, emphasizing the process of taking a limit as 'n' approaches infinity.
- 📚 The lower and upper sums are calculated by dividing the interval into 'n' sub-intervals and considering the minimum and maximum function values within each sub-interval, respectively.
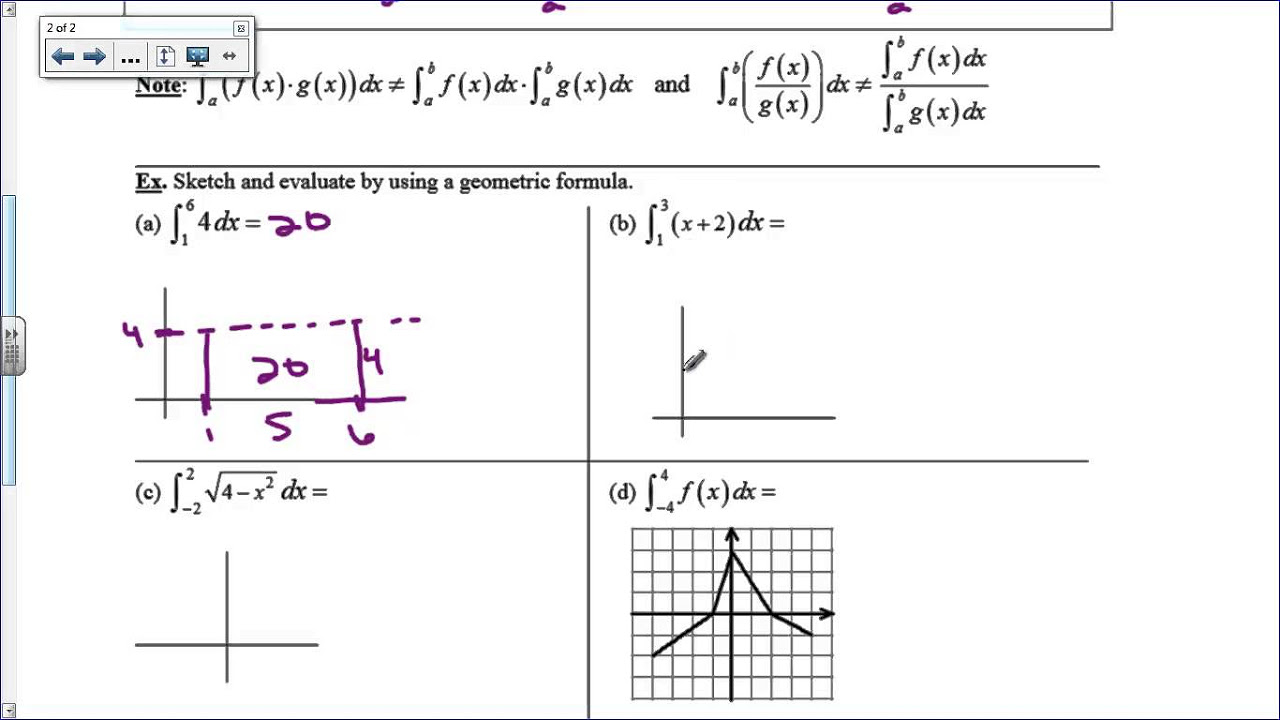
- 🔑 The 'a' and 'b' in the integral notation represent the limits of integration, indicating the range of 'x' values over which the area under the graph is evaluated.
- 🧠 The process of integration, while initially lengthy, is fundamental to understanding more advanced concepts and techniques in calculus.
- 🔗 The video script hints at a connection between integration and differentiation, suggesting that understanding one process can lead to insights about the other.
- 🚀 The script encourages viewers to subscribe to the channel for updates and to continue learning about calculus and its applications.
Q & A
What is the purpose of finding the lower sum in the context of integration?
-The purpose of finding the lower sum is to approximate the area under the graph of a function by using the minimal 'y' values as the heights of rectangles in each sub-interval. As the number of sub-intervals increases, the lower sum approaches the actual area under the graph.
Why do we consider the minimum 'y' values in each sub-interval for the lower sum?
-We consider the minimum 'y' values because they provide a conservative estimate for the area under the curve, ensuring that the calculated sum is always less than or equal to the actual area, thus giving a lower bound for the integral.
What is the significance of the upper sum in integration?
-The upper sum is significant as it provides an overestimation of the area under the curve by using the maximum 'y' values in each sub-interval as the heights of rectangles. It gives an upper bound for the integral and, like the lower sum, approaches the actual area as the number of sub-intervals increases.
How does the concept of the upper sum differ from the lower sum?
-The upper sum uses the maximum 'y' value in each sub-interval to calculate the heights of the rectangles, whereas the lower sum uses the minimum 'y' value. This results in the upper sum always being greater than or equal to the lower sum, with both converging to the actual area under the graph as the number of sub-intervals tends to infinity.
What does it mean to take any 'y' value between the maximum and minimum in each sub-interval for integration?
-Taking any 'y' value between the maximum and minimum in each sub-interval means using that value as the height of the rectangle to approximate the area under the curve. This method ensures that the sum of areas will always be between the lower and upper sums and will approach the actual area under the graph as the number of sub-intervals increases.
Why do we denote the integral with a bar above the symbol?
-The bar above the symbol in the integral notation signifies that it represents the upper sum, which is an approximation of the area under the graph using the maximum 'y' values in each sub-interval.
How does the width of the rectangles relate to the number of sub-intervals?
-As the number of sub-intervals increases, the width of each rectangle (denoted by 'dx') becomes infinitesimal, meaning it approaches zero. This leads to a more accurate approximation of the area under the curve by adding the areas of very thin rectangles.
What is the role of 'dx' in the integral notation?
-'dx' in the integral notation represents an infinitesimal change in the x-variable, indicating that as we increase the number of sub-intervals, we are summing the areas of rectangles with very small widths, leading to a precise approximation of the integral.
What does the symbol '∫' represent in the context of integration?
-The symbol '∫' represents the integral, which is the limit of the sum of areas of rectangles as the number of sub-intervals tends to infinity. It signifies the process of finding the exact area under the graph of a function.
How does the process of integration relate to differentiation?
-Integration and differentiation are related through the fundamental theorem of calculus. The integral provides a way to find the area under the curve, while differentiation gives the slope of the tangent to the curve at any point. The integral can be seen as the reverse process of differentiation.
Why is the process of integration described as lengthy and cumbersome in the script?
-The process of integration is described as lengthy and cumbersome because it involves dividing the area under the curve into many sub-intervals, calculating the areas of rectangles, and taking limits. However, this detailed process helps in understanding the concept of integration before moving on to more efficient methods.
Outlines
📊 Understanding the Concept of Lower and Upper Sums
This paragraph explains the process of finding the area under a function's graph by using the concept of lower and upper sums. It begins by discussing how the lower sum is calculated by taking the minimum 'y' values within each sub-interval and how this sum approaches the actual area under the graph as the number of sub-intervals 'n' increases. The paragraph then explores the significance of using minimum values and contrasts it with using maximum 'y' values, which results in the upper sum. The text also touches on the idea of using any 'y' value between the minimum and maximum within a sub-interval, which will also lead to the area under the graph as 'n' approaches infinity. The integral of a function is introduced as the limit of the sum of areas of rectangles, which can be represented by either the lower or upper sums in the limit as 'n' tends to infinity.
📚 Symbolic Representation and the Fundamentals of Integration
The second paragraph delves into the symbolic representation of integration, explaining the notation used for lower and upper sums and the significance of 'f(x)dx' in representing the area of an infinitesimal rectangle. The paragraph clarifies the use of 'dx' instead of 'Δx' to denote an infinitely small width of the rectangles as the number of sub-intervals increases. It emphasizes that the integral represents the limit of these sums, not just the sum itself, which is why the integral symbol uses a long 's' instead of the summation symbol (Σ). The paragraph concludes by discussing the meaning of 'a' and 'b' in the integral notation, which define the limits of integration along the x-axis. It also poses a challenge to the viewer to find the integral of a given function between specific limits and hints at the connection between integration and differentiation, which will be explored in future videos.
Mindmap
Keywords
💡Area under the graph
💡Lower sum
💡Upper sum
💡Sub-intervals
💡Integral
💡Minimum and Maximum 'Y' values
💡Rectangles
💡Limit
💡Integration
💡Differentiation
💡Infinitesimal
Highlights
Explained the concept of finding the area under a graph using lower sums by taking minimal 'y' values in each sub-interval.
Discussed the significance of considering minimum 'y' values in each sub-interval for lower sums.
Introduced the idea of using maximum 'y' values to form upper sums and how they compare to the area under the graph.
Demonstrated that increasing the number of sub-intervals does not change the fact that the upper sum is always greater than the area under the graph.
Clarified that both lower and upper sums approach the area under the graph as 'n' tends to infinity.
Explored the possibility of using any 'y' value between the maximum and minimum in each sub-interval for integration.
Explained that the sum of areas using any 'y' value between the extremes will always lie between the lower and upper sums.
Asserted that the limit of the sum of areas of rectangles, regardless of 'y' value chosen, approaches the area under the graph.
Defined the Integral of a function as the limit of the sum of areas of rectangles.
Provided a general process for finding the integral of a function between 'a' and 'b'.
Described the lower and upper sums and how they are formed using minimum and maximum function values.
Introduced the notation 'f(x)dx' to denote the area of an infinitesimal rectangle in integration.
Explained the use of 'dx' instead of 'Delta X' to signify the width of the rectangles becoming infinitesimally small.
Highlighted that the integral is the limit of the sums, not the sum itself, and the significance of the 'S' symbol.
Discussed the meaning of 'a' and 'b' in the integral notation and their role in defining the interval for integration.
Challenged the viewer to find the integral of a given function between X=0 and X=4.
Teased the upcoming connection between integration and differentiation.
Acknowledged the lengthiness of the integration process and hinted at a more efficient method to be introduced.
Transcripts
Browse More Related Video
Riemann Sums and Definite Integrals
Calculus - Lesson 13 | Integral of a Function | Don't Memorise
AP Calculus AB: Lesson 6.2 Part 2 (Limit Definition of Definite Integral)
The Definite Integral Part II: Using Summation Notation to Define the Definite Integral
What Is an Integral?
BusCalc 13.4 Riemann Sums
5.0 / 5 (0 votes)
Thanks for rating: