Calculus - Lesson 12 | Addition as Integration | Don't Memorise
TLDRThis video script introduces the concept of integration as an advanced method of addition, particularly useful for calculating continuous quantities like water drop accumulation or vehicle counts on a highway. It illustrates the geometric connection between addition and the area under a curve, using the analogy of earning points in a video game with a rate that increases over time. The script explains that the integral of a function, which represents the rate of a quantity, can be used to find the total amount of that quantity. The example of earning points weekly, where the rate is the square of the number of weeks, demonstrates how integration provides a more accurate total than simple multiplication, setting the stage for further exploration of integration techniques in upcoming videos.
Takeaways
- 💧 The script begins with a question about calculating the amount of water accumulated in an hour, suggesting a simple counting method and hinting at a more efficient approach.
- 📏 It introduces the concept of a constant rate of drops falling per minute, allowing for straightforward calculation of total drops in an hour.
- 🚗 The script then shifts to discuss traffic flow as an analogy for continuous quantities, similar to water flow, to illustrate the complexity of adding continuous quantities.
- 🧩 The video aims to upgrade the basic skill of addition to handle continuous quantities through the process of integration, which is likened to a more advanced form of addition.
- 📊 Integration is connected to geometry and addition, with the script providing an example of counting points on a screen versus on a continuous line, emphasizing the concept of length over discrete points.
- 🎮 A hypothetical scenario is presented involving a video game where points are earned at a rate that increases with time, showcasing a practical application of the concepts discussed.
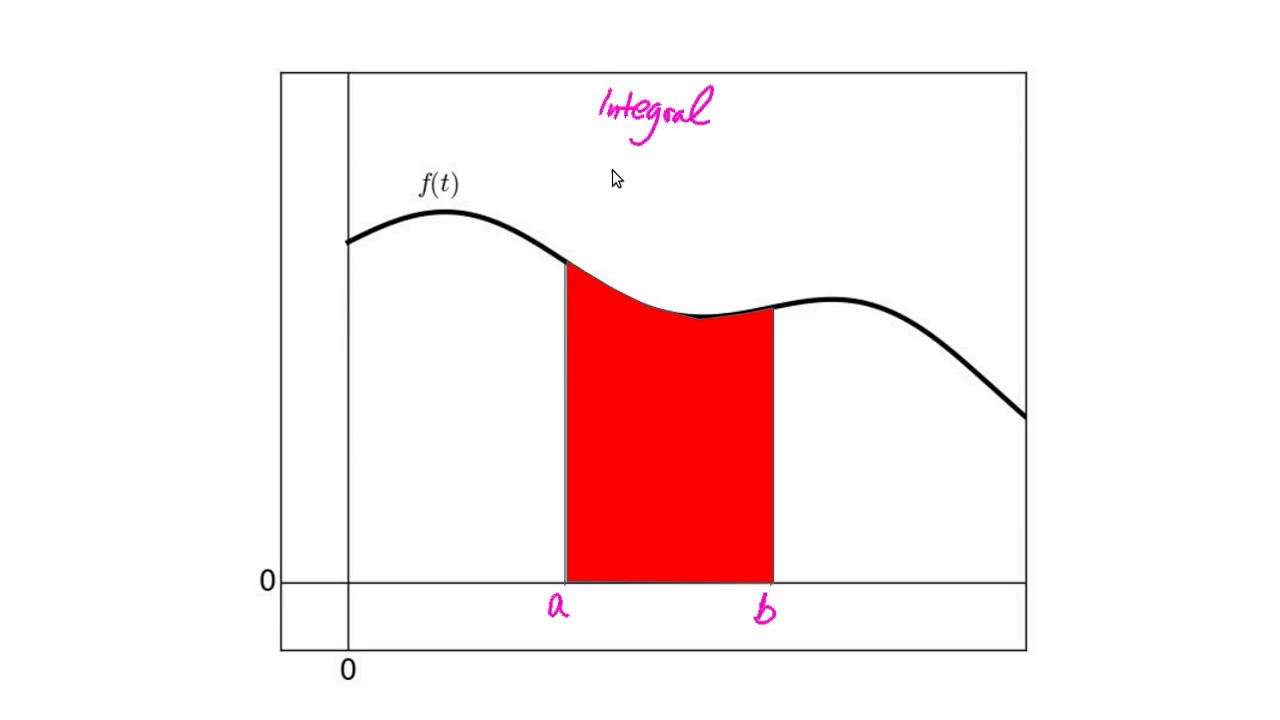
- ⏳ The script explains that the rate of earning points is not constant and introduces the graphical representation of this rate over time, using the area under the curve to represent total points earned.
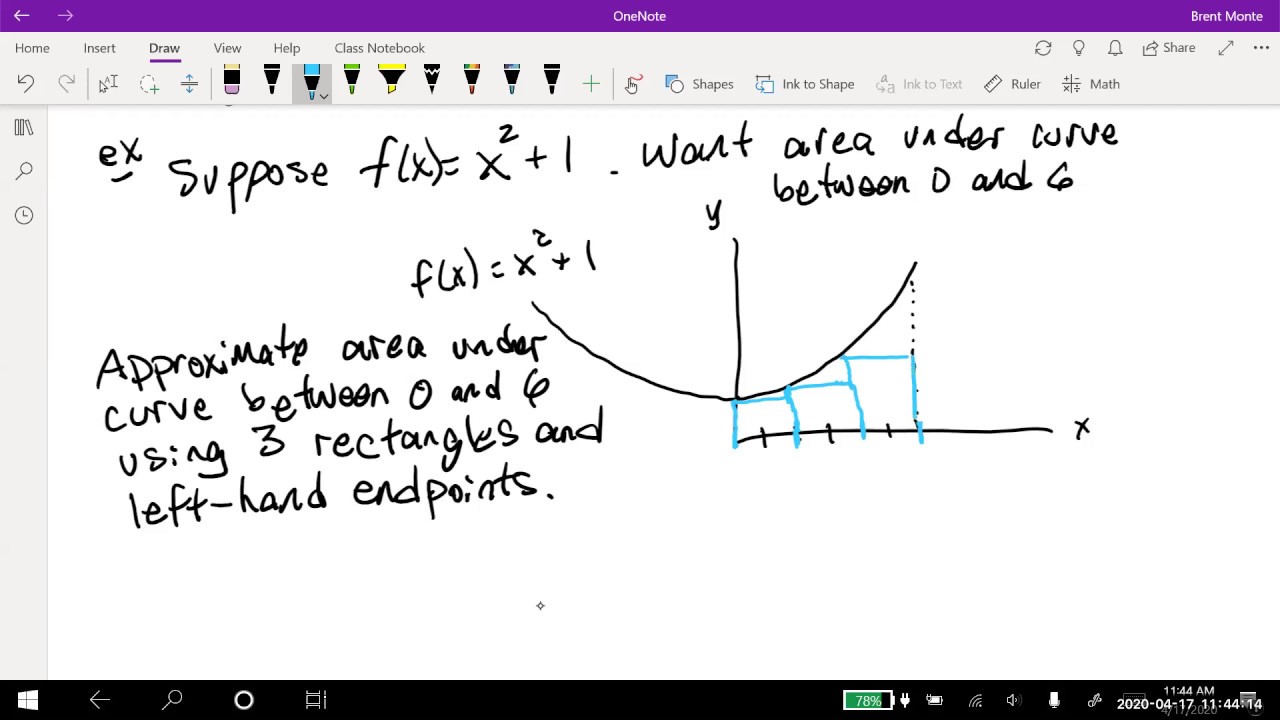
- 📈 The concept of approximating the area under a curve by breaking it into rectangles is introduced, with the rectangles' areas representing the points earned during each time segment.
- 🔍 The importance of considering shorter durations to improve the accuracy of the estimate is highlighted, as it brings the approximation closer to the actual curve.
- 📚 The script concludes by emphasizing that the process of finding the area under a curve, or the integral of a function, is the solution to problems involving continuous rates of change.
- 🔗 The video promises to teach the process of integration in upcoming videos, encouraging viewers to subscribe for updates.
Q & A
What is the initial problem presented in the script?
-The initial problem presented is to determine the amount of water accumulated in an hour, given a constant rate of drops falling per minute.
What is the constant rate of drops falling per minute mentioned in the script?
-The constant rate of drops falling per minute mentioned is 100 drops per minute.
How many drops would accumulate in an hour if the rate is constant at 100 drops per minute?
-If the rate is constant at 100 drops per minute, 6000 drops would accumulate in an hour.
What is the alternative scenario presented to illustrate a different type of problem?
-The alternative scenario is to find the number of vehicles traveling on a busy highway in a day, considering the stream of vehicles as a continuous quantity like water.
What mathematical process is introduced to handle continuous quantities and improve the skill of addition?
-The mathematical process introduced is integration, which is used to handle continuous quantities and improve the skill of addition.
How is integration related to finding the area or volume of different shapes?
-Integration is used to find the area under the curve of a function, which can be related to finding the volume or area of different shapes by summing up infinitesimally small elements.
What is the example given to illustrate the concept of continuous quantities in the context of a video game?
-The example given is about earning points in a video game, where the rate of earning points is represented by the square of the number of weeks, illustrating a continuously growing rate.
How does the script illustrate the incorrect assumption made in the initial calculation of points earned in the video game example?
-The script points out that the incorrect assumption was that the rate of earning points was constant during each week, while in reality, the rate was continuously growing.
What graphical representation is used to show the relationship between the rate of earning points and the total points earned?
-The script uses a graph with the number of weeks on the x-axis and the rate of earning points on the y-axis, where horizontal lines represent the assumed constant rate for each week.
How does the script suggest improving the estimate of total points earned in the video game example?
-The script suggests considering shorter durations (like half a week) and using smaller rectangles to approximate the area under the curve, which leads to a better estimate of the total points earned.
What is the final insight provided by the script regarding the connection between geometry and addition?
-The final insight is that if you have a function representing the rate of some quantity, the area under the graph of that function (found through integration) tells you the total amount of that quantity.
Outlines
💧 Introduction to Continuous Quantities and Integration
The script begins by posing the question of how to measure the accumulation of water over time, comparing counting individual drops to a more efficient method. It introduces the concept of a constant rate of drops falling per minute, leading to a simple calculation of 6000 drops in an hour. The discussion then shifts to the analogy of vehicles on a highway, highlighting the need to deal with continuous quantities. The script emphasizes the limitations of basic addition and multiplication when dealing with continuous quantities and introduces integration as the next level of addition. The concept of geometry and its relation to addition is presented through the idea of counting points on a screen versus along a continuous line. The video promises to explore the connection between geometry and addition, and how integration can be used to solve problems involving continuous quantities, such as calculating the total points earned in a video game based on a rate that increases with time.
📊 Understanding the Process of Integration through Area Under the Curve
This paragraph delves into the process of integration by using the example of earning points in a video game, where the rate of earning points is represented by a function of time. The script explains how the total points can be visualized as the area under a graph representing the rate of points earned over time. Initially, the script compares the incorrect method of assuming a constant rate per week to the correct approach of considering the rate as continuously changing. It illustrates how breaking down the time into smaller intervals (like halves of a week) and calculating the area under the corresponding rectangles provides a more accurate estimate of the total points. The script then suggests that by further decreasing the time intervals, the sum of the areas of the rectangles will approach the actual area under the curve, which is the integral of the function. The paragraph concludes by emphasizing that integration is the mathematical tool used to find this area, and it invites the viewer to stay tuned for the next video where the process of finding the integral will be explained.
Mindmap
Keywords
💡Integration
💡Rate of Drops Falling
💡Continuous Quantity
💡Discrete Quantity
💡Geometry
💡Volume
💡Area Under the Graph
💡Horizontal Lines
💡Integral
💡Estimate
💡Graphical Representation
Highlights
Exploring an alternative method to count water drops by analyzing the rate of drops falling per minute.
Introduction of the concept of integration to deal with continuous quantities.
Comparing the discrete counting of drops to the continuous flow of vehicles on a highway.
The need to upgrade basic addition skills to handle continuous quantities.
Linking the process of integration to finding areas or volumes in geometry.
The analogy of counting points on a screen versus on a continuous line.
Introducing a hypothetical video game scenario to illustrate the concept of integration.
The incorrect assumption of constant earning rates in the points calculation.
Graphical representation of the earning rate function and its implications.
Using rectangles to represent the total points earned during each week.
The discrepancy between the calculated points and the actual points due to variable rates.
Improving the estimate by considering shorter durations and smaller rectangles.
The concept that as rectangles' widths decrease, the total area approaches the area under the curve.
The integral of a function representing the rate of a quantity and its total amount.
The upcoming video's promise to explain how to find the integral of a function.
Transcripts
Browse More Related Video
Introducing Integration (3 of 4: Notation)

Interpreting definite integral as net change | AP Calculus AB | Khan Academy

Area under rate function gives the net change | AP Calculus AB | Khan Academy
Why Are Slope and Area Opposite: The Fundamental Theorem of Calculus
Math 11 - Section 4.2

1.3 - Average Rates of Change
5.0 / 5 (0 votes)
Thanks for rating: