Ferris Wheel Trig Problem (part 2)
TLDRThe video script demonstrates the process of graphing the height function of a Ferris wheel over time. The function h(t) = 9 - 8cos(18t) is explored, with t representing time in seconds. The instructor simplifies the problem by first graphing h(θ) = 9 - 8cos(θ) and then adjusting for the 18t factor. Key points are identified at specific time intervals, and a table is used to calculate corresponding heights, revealing a pattern. The graph is sketched, showing a sinusoidal curve that represents the height's periodic change. The video concludes with an approximation of the height at t=4 and an exact height at t=10, offering a practical approach to understanding trigonometric functions and their applications.
Takeaways
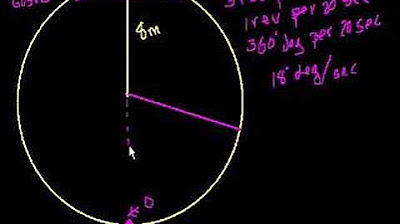
- 🎢 The function representing the height of the Ferris wheel, h(t), is given by h(t) = 9 - 8cos(18t) where t is in seconds.
- 📈 The task is to graph the function h(t) between 0 ≤ t ≤ 30 seconds.
- 🤔 The script discusses a method to simplify the graphing process by first graphing h(θ) = 9 - 8cos(θ) and then adjusting for the 18t factor.
- 🕒 The script calculates the value of θ for t = 30 seconds, which is 30 × 18 = 540 degrees.
- 📊 A table is created to find the height h at specific times corresponding to degrees that are easy to calculate for cosine values.
- 🗓 The times corresponding to θ = 0, 90, 180, 270, 360, 450, and 540 degrees are t = 0, 5, 10, 15, 20, 25, and 30 seconds respectively.
- 📝 The script provides a step-by-step calculation of the height h at these specific times, using the cosine values for the given degrees.
- 📉 The graph of h(t) is plotted by identifying key points and sketching a sine wave-like curve that oscillates between 1 and 17 meters.
- 👀 The script acknowledges a mistake in the calculation of h(t) for t = 30 seconds, correcting it from 15 to 17 meters.
- 🔍 The script approximates the height of the Ferris wheel at t = 4 seconds, suggesting it is a little less than 9 meters.
- 🎉 The final graph is drawn, and the script concludes with a summary of the process and an encouragement to enjoy the task.
Q & A
What is the function h(t) representing in the context of the script?
-The function h(t) represents the height of the Ferris wheel at any time t, where t is measured in seconds.
What is the mathematical expression for h(t) given in the script?
-The mathematical expression for h(t) is h(t) = 9 - 8cos(18t).
What is the range of t for which the function h(t) needs to be graphed?
-The function h(t) needs to be graphed for the range 0 ≤ t ≤ 30 seconds.
Why does the person in the script choose to graph a different function first?
-The person chooses to graph a different function first to simplify the process and make it easier to understand the pattern before translating it to the original function h(t).
What is the simplified function the person decides to graph first?
-The simplified function the person decides to graph first is h(theta) = 9 - 8cos(theta).
What is the significance of the number 18 in the context of the script?
-The number 18 is the coefficient of t in the cosine function within h(t), which affects the period of the cosine wave and thus the motion of the Ferris wheel.
How does the person in the script determine the corresponding theta values for t = 30 seconds?
-The person multiplies t by 18 to find the corresponding theta value, which results in 540 degrees.
What method does the person use to find the height of the Ferris wheel at specific times without a calculator?
-The person uses a table to list specific theta values and their corresponding t values, then calculates the height using the known cosine values for those angles.
What is the height of the Ferris wheel when t equals 0, according to the script?
-When t equals 0, the height of the Ferris wheel is 1 unit, since cos(0) = 1 and h(0) = 9 - 8*1 = 1.
How does the person correct their mistake regarding the height at t = 30 seconds?
-The person corrects their mistake by recalculating the height at t = 30 seconds as 17 units instead of 15, after realizing the error in their addition.
What is the final shape of the graph for h(t) according to the script?
-The final shape of the graph for h(t) is a sinusoidal wave that curves up and down, resembling a sine wave, within the specified range of t.
How does the person approximate the height of the Ferris wheel at t = 4 seconds?
-The person approximates the height at t = 4 seconds as a little bit less than 9 units, based on the pattern observed in the graph.
Outlines
🎡 Understanding the Ferris Wheel Height Function
The video script begins by explaining a mathematical problem involving the height function of a Ferris wheel, which is given as h(t) = 9 - 8cos(18t), where t represents time in seconds. The goal is to graph this function for the time interval from 0 to 30 seconds. The script suggests a method to simplify the graphing process by first plotting the function h(theta) = 9 - 8cos(theta) and then adjusting for the specific time function. The script also explains how to calculate the value of theta for t = 30 seconds, which is 540 degrees, and how to determine the corresponding time for various degrees by dividing by 18. A table is used to calculate the height at specific times, such as at 0, 5, 10, 15, 20, 25, and 30 seconds, by evaluating the cosine of the respective degrees and applying it to the height function. The script concludes with a step-by-step approach to graphing the function, emphasizing the importance of understanding the relationship between time and height on the Ferris wheel.
📈 Graphing the Ferris Wheel Height Function
This paragraph continues the explanation of graphing the Ferris wheel's height function. The script identifies key points by calculating the height at specific times corresponding to degrees that are easy to evaluate, such as 0, 90, 180, 270, 360, and 450 degrees. It then plots these points on a graph, noting that the height repeats in a pattern every 15 seconds due to the periodic nature of the cosine function. The script corrects a mistake in the calculation, emphasizing the importance of accuracy in mathematical processes. The graph is sketched with the points plotted, showing a sinusoidal pattern that represents the height of the Ferris wheel over time. The script also approximates the height at t = 4 seconds and provides the exact height at t = 10 seconds. The video concludes with a brief recap of the process and an encouragement to the viewer to enjoy the problem-solving experience.
Mindmap
Keywords
💡Ferris Wheel
💡Function of Time
💡Cosine Function
💡Graph
💡Time Interval
💡Theta
💡Degrees
💡Trigonometric Table
💡Unit Circle
💡Approximation
Highlights
The function of the height of the ferris wheel is given by h(t) = 9 - 8cos(18t), where t is in seconds.
The task is to graph the height function h(t) between 0 ≤ t ≤ 30 seconds.
The approach involves graphing a simpler function first and then adjusting to the given function.
A preliminary graph is drawn for h(θ) = 9 - 8cos(θ) to understand the pattern.
Theta values are calculated for t = 30 seconds, resulting in 540 degrees.
Theta values are marked at 0, 90, 180, 270, 360, 450, and 540 degrees for easier calculation.
Time values corresponding to these theta values are determined by dividing by 18.
A table is created to find the height at specific theta values without a calculator.
The cosine values for the given theta degrees are calculated manually.
Key points are identified where the height function repeats its values.
The height function's values are plotted at t = 0, 5, 10, 15, 20, 25, and 30 seconds.
A pattern is observed in the height values, repeating every 5 seconds.
The graph of the height function is sketched, showing a sinusoidal pattern.
The graph is refined to accurately represent the sinusoidal nature of the height function.
An approximation is made for the height at t = 4 seconds, estimated to be slightly less than 9 meters.
The exact height at t = 10 seconds is confirmed to be 17 meters.
The process concludes with a visual representation of the ferris wheel's height over time.
Transcripts
5.0 / 5 (0 votes)
Thanks for rating: