Graphing Inverse Functions
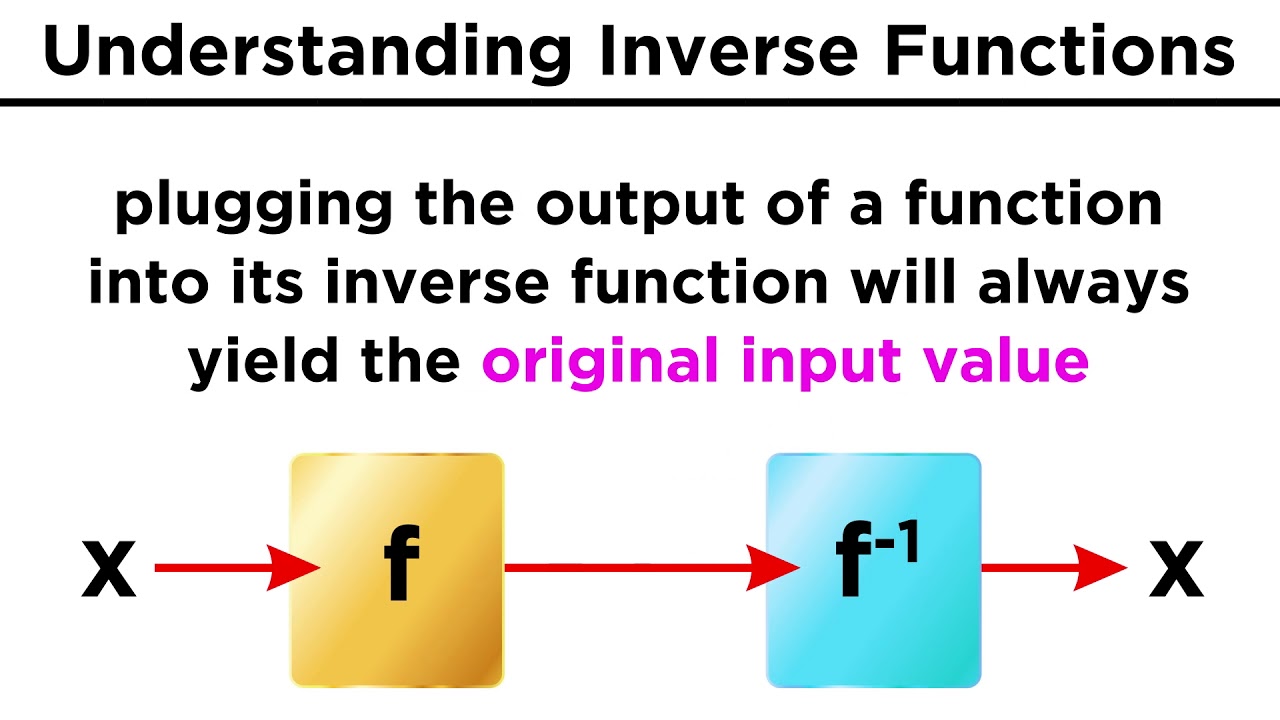
TLDRThis instructional video focuses on graphing the inverse function of a given function. It explains the concept of reflection across the line y=x to sketch the inverse function, demonstrating the process with various examples. The video also covers how to graph the inverse function using points by switching the x and y coordinates of the original function's points. It emphasizes the importance of accuracy in plotting points to ensure the correct graphical representation of the inverse function, highlighting the symmetry between the original function and its inverse.
Takeaways
- 📚 The lesson focuses on graphing the inverse function of a given function.
- 🔄 To graph an inverse function, reflect the original function across the line y=x.
- 📈 The inverse function is symmetric with respect to the line y=x.
- 📝 Start by drawing the original function and then sketch the inverse function by reflecting it.
- 📌 Use the line y=x as a reference to ensure the symmetry of the inverse function.
- 📊 Graphing an inverse function can be done by plotting points or by drawing a rough sketch.
- 🔢 When using points to graph, switch the x and y values to find the inverse function's points.
- 📐 The distance between the original function and the line y=x should be equal to the distance between the inverse function and the line y=x.
- 📈 The graphical relationship between a function and its inverse is one of reflection and symmetry across y=x.
- 🚀 The video provides step-by-step instructions for graphing inverse functions using both rough sketches and points.
- 💻 Encourages viewers to pause the video and try graphing the inverse functions themselves.
Q & A
What is the primary focus of the lesson in the provided transcript?
-The lesson focuses on graphing the inverse function of a given function.
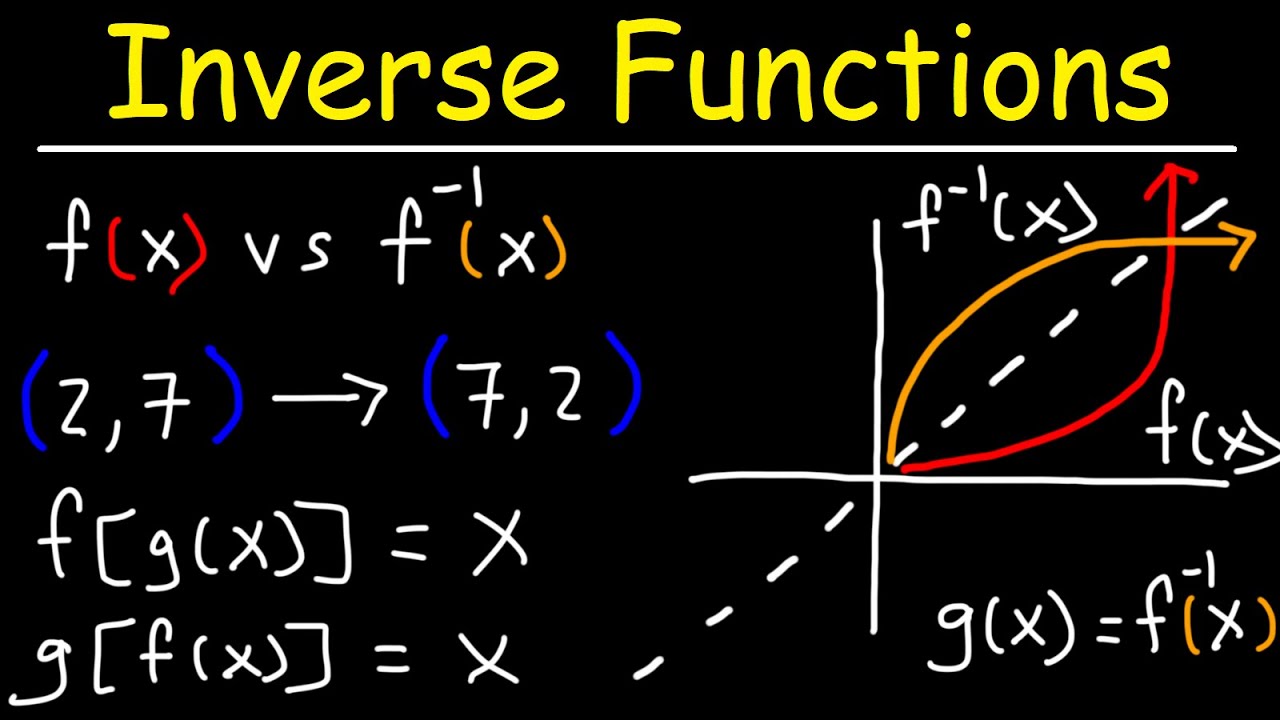
How is the inverse function related to its original function in terms of graphing?
-The inverse function is a reflection of the original function across the line y equals x.
What is the first step in graphing the inverse function using a rough sketch?
-The first step is to draw the line y equals x, which serves as the axis of symmetry for the inverse function.
Can you describe the process of graphing the inverse function using a rough sketch as outlined in the transcript?
-To graph the inverse function using a rough sketch, start by drawing the original function, then reflect it across the line y equals x to form the inverse function.
What is an alternative method to graph the inverse function mentioned in the transcript?
-An alternative method is to graph the inverse function using points by switching the x and y coordinates of the original function's points.
How does the transcript suggest ensuring the accuracy of the inverse function's graph?
-The transcript suggests being careful with the steps, especially when switching points for the inverse function, to avoid errors that could affect the graph.
What is the significance of the points being equidistant from the line y equals x in the context of the inverse function?
-The equidistance of points from the line y equals x confirms that the graph of the inverse function is correctly reflecting the original function across the line of symmetry.
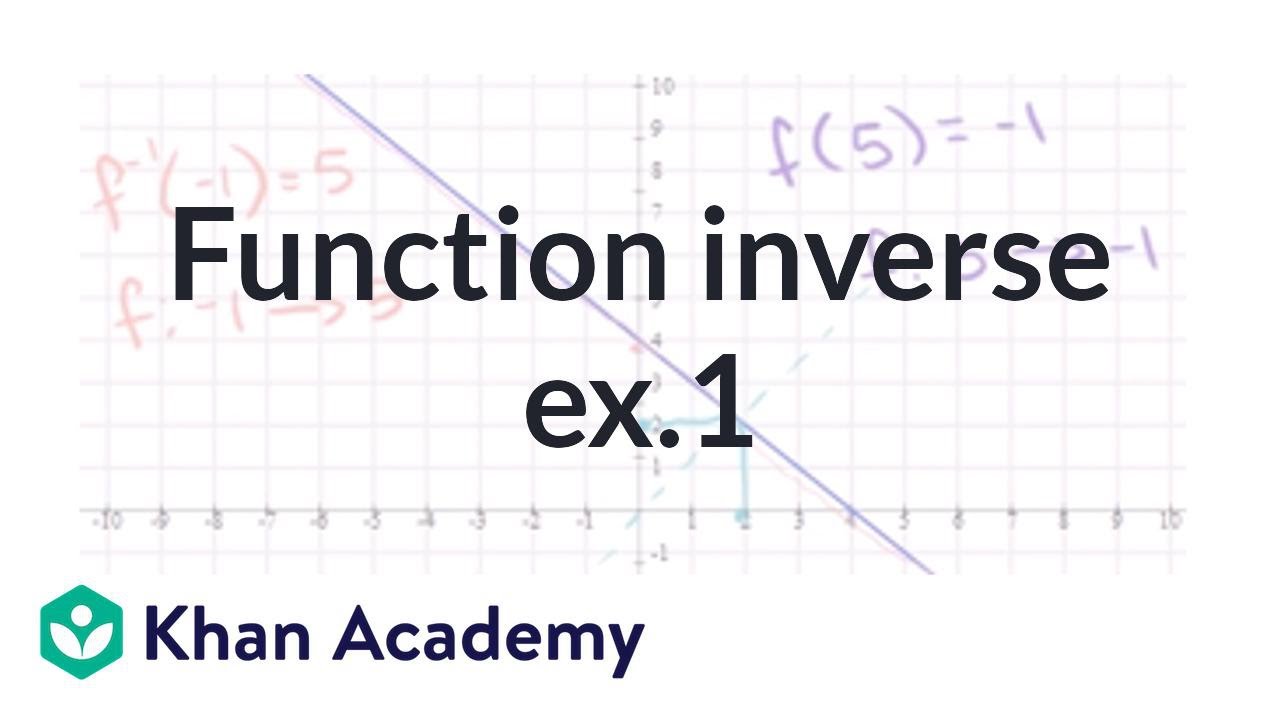
How does the transcript illustrate the symmetry between the original function and its inverse function?
-The transcript uses examples where the original function and its inverse function are drawn, showing that they are symmetric about the line y equals x.
What is the importance of making a table for the points of the original function when graphing its inverse function?
-Making a table helps organize the points and ensures that the x and y coordinates are correctly switched when plotting the inverse function.
Can you provide an example from the transcript where the original function starts on the negative x-axis and how its inverse function is drawn?
-In one of the examples, the original function starts on the negative x-axis, and its inverse function starts from the negative y-axis, reflecting across the line y equals x.
How does the transcript guide viewers to check their work when graphing the inverse function?
-The transcript guides viewers to check their work by comparing the distance between the original function and the line y equals x with the distance between the inverse function and the same line, ensuring they are equal.
Outlines
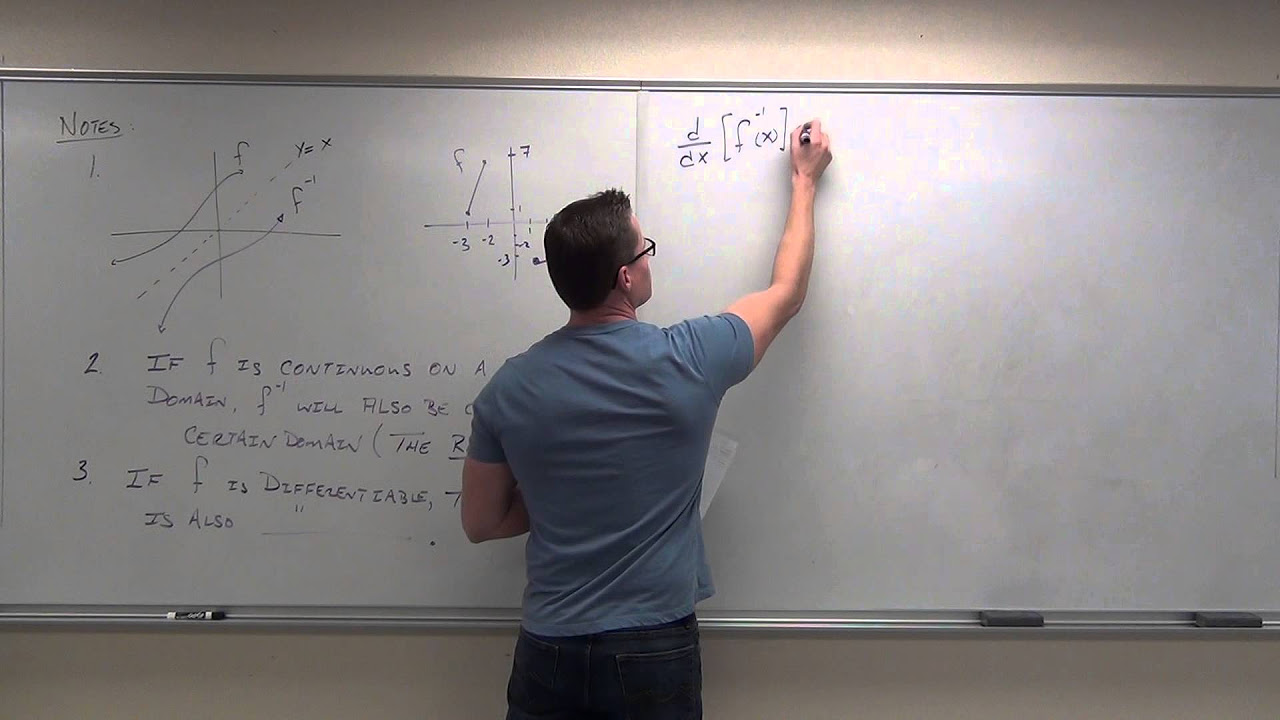
📚 Introduction to Graphing Inverse Functions
This paragraph introduces the concept of graphing inverse functions. It explains that the inverse function, denoted as g(x), is a reflection of the original function f(x) across the line y=x. The speaker demonstrates how to sketch the inverse function by reflecting the original function over the y=x line, providing a visual understanding of the symmetry between a function and its inverse.
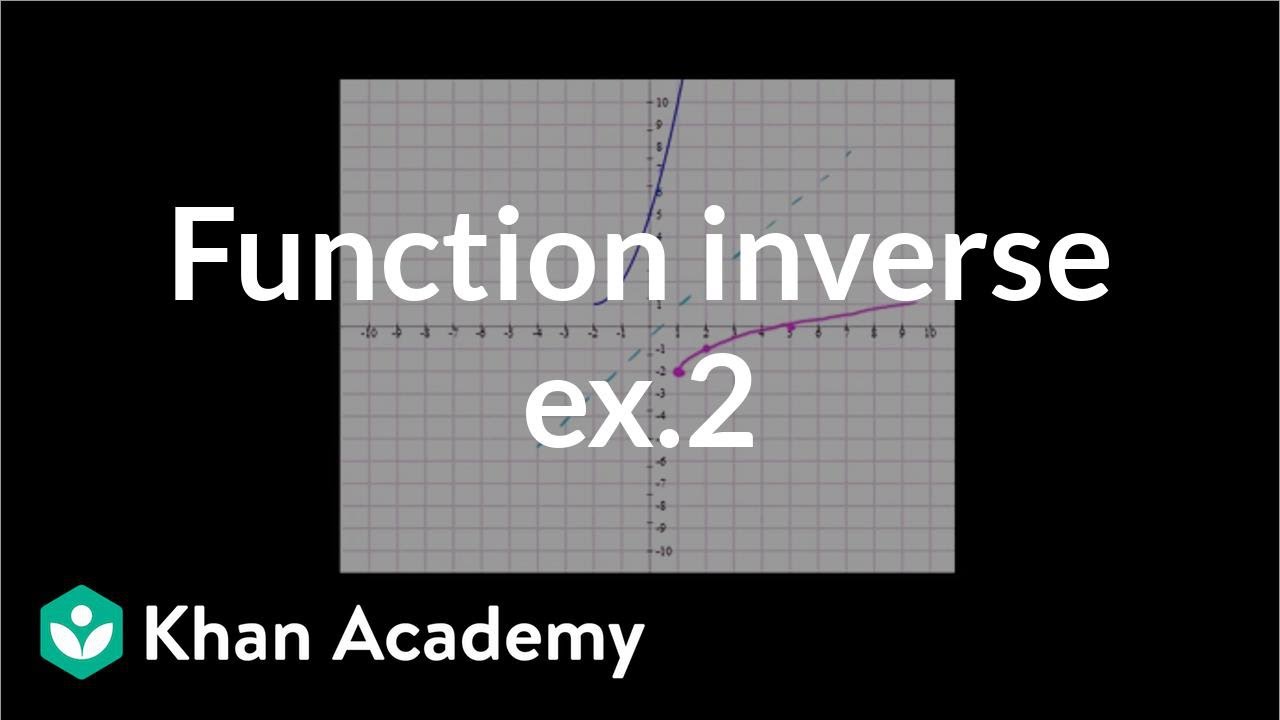
📈 Graphing Inverse Functions Using Points
The second paragraph delves into the method of graphing inverse functions using specific points. It describes a step-by-step process where points from the original function f(x) are plotted and then their coordinates are switched to create the inverse function g(x). The speaker emphasizes the importance of accuracy in plotting these points to ensure the correct graphical representation of the inverse function. The summary also mentions the use of a table to organize the points and the reflection symmetry observed between the original and inverse functions.
🔍 Detailed Example of Plotting Inverse Functions
The final paragraph provides a detailed example of plotting an inverse function. It starts by listing a series of points that form the graph of the original function f(x). The speaker then guides the viewer through switching the x and y coordinates of these points to plot the inverse function g(x). The paragraph concludes by reinforcing the concept of symmetry between the original and inverse functions, highlighting the visual relationship and the equal distance of points from the line y=x.
Mindmap
Keywords
💡Graphing
💡Inverse Function
💡Reflection
💡Line y=x
💡Symmetric
💡Rough Sketch
💡Points
💡X and Y Table
💡Equidistant
💡Graphical Relationship
Highlights
The lesson focuses on graphing the inverse function.
A function f(x) is considered, along with its inverse g(x).
Graphing the inverse function involves reflecting f(x) across the line y=x.
The inverse function g(x) is symmetric about the line y=x.
Examples are provided to illustrate the graphing process.
The starting point of f(x) on the x-axis determines the starting point of g(x) on the y-axis.
Graphing the inverse function can also be done using points.
A smaller graph is used to demonstrate graphing with points.
Points for f(x) are given and used to plot the graph.
To find points for g(x), switch the x and y coordinates of f(x)'s points.
An x-y table is created for f(x) to organize the points.
Plot the points of g(x) by switching the coordinates from f(x)'s table.
Connect the plotted points to form the graph of g(x).
The distance between f(x) and y=x must be equal to that between g(x) and y=x.
Another example is given with a set of points for f(x).
Points for the inverse function g(x) are found by switching the x and y values.
The graphical relationship between a function and its inverse is demonstrated through symmetry about y=x.
The method concludes with understanding the graphical symmetry between f(x) and g(x).
Transcripts
Browse More Related Video
5.0 / 5 (0 votes)
Thanks for rating: