ROC Curves
TLDRThe transcript discusses Receiver Operating Characteristic (ROC) curves, which are graphical representations used to assess the diagnostic ability of a test. It explains the concepts of sensitivity and specificity, and how they trade off against each other when setting a test's decision threshold. The area under the ROC curve (AUC) is introduced as a measure of a test's overall performance, with higher values indicating better diagnostic ability. The historical context of ROC curves originating from radar signal detection in World War II is also briefly touched upon, highlighting their evolution into a crucial tool in medical testing interpretation.
Takeaways
- 📈 Receiver Operating Characteristic (ROC) curves are used to evaluate the performance of a diagnostic test by showing how well it can distinguish between two groups, such as those with and without a disease.
- 🔍 The curve is plotted with the true positive rate (sensitivity) on the y-axis and the false positive rate (1 - specificity) on the x-axis, highlighting the trade-off between sensitivity and specificity.
- 🏥 The area under the ROC curve (AUC) is a measure of the test's ability to discriminate between positive and negative cases, with values ranging from 0 to 1, where 1 indicates perfect discrimination.
- 📊 A larger AUC indicates a better test, with values of 0.9 to 1 considered excellent, 0.7 to 0.8 fair, and below 0.5 a failure.
- 🔄 The relationship between sensitivity and specificity is inverse; as one increases, the other decreases, which is reflected in the shape of the ROC curve.
- 📌 The choice of cutoff point for a test's positivity affects its sensitivity and specificity, and thus its position on the ROC curve.
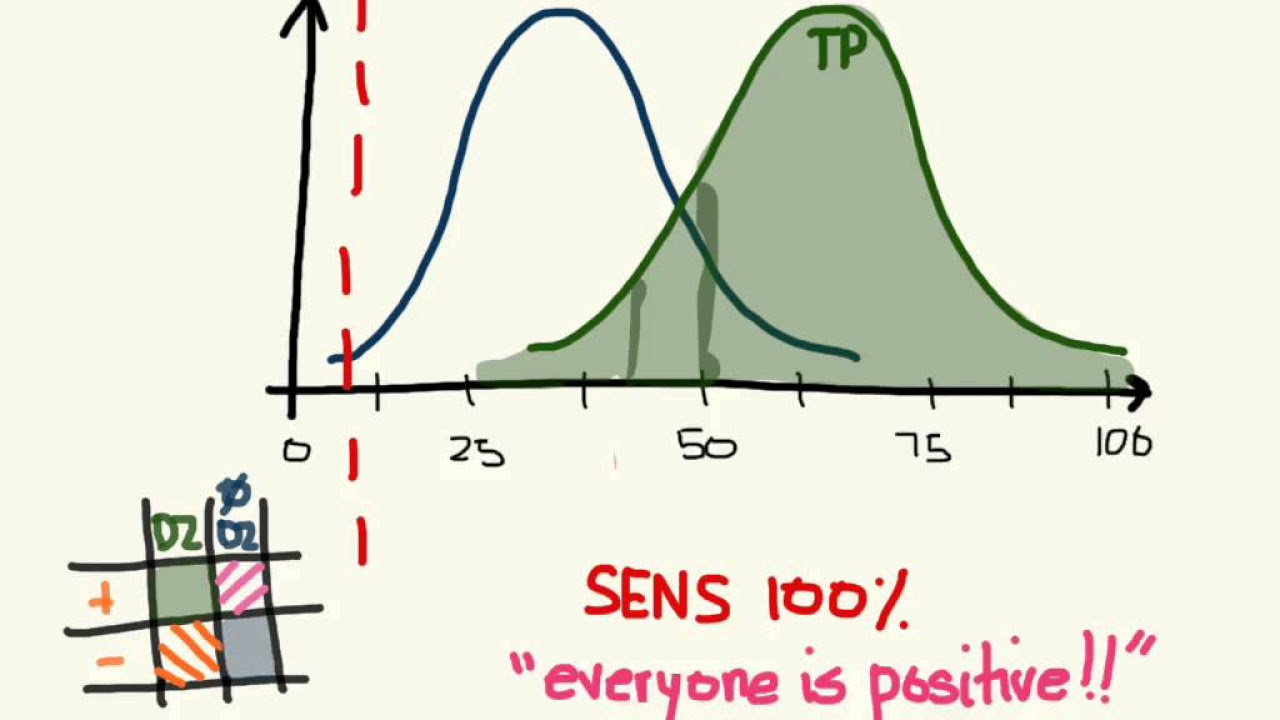
- 🌐 Overlapping distributions of test results from diseased and non-diseased patients make it more challenging to distinguish between the two, leading to a less effective test.
- 🛠️ ROC curves can be used to compare different tests by looking at their AUCs, allowing for the selection of the most effective test.
- 📚 The concept of ROC curves originated from World War II radar signal detection theory, where 'receiver operators' had to determine whether radar blips were enemy signals or noise.
- 🏫 The application of ROC curves to medical test results began in the 1970s, providing a valuable tool for assessing diagnostic tests.
Q & A
What is the purpose of a Receiver Operating Characteristic (ROC) curve?
-The purpose of an ROC curve is to graphically represent the diagnostic ability of a binary classifier system, such as a medical test. It illustrates the diagnostic ability of the test by plotting the true positive rate (sensitivity) against the false positive rate (1 - specificity) at various threshold settings.
How are sensitivity and specificity related to the true positive rate and false positive rate in the context of an ROC curve?
-Sensitivity, or the true positive rate, is the proportion of actual positives that are correctly identified by the test. Specificity, on the other hand, is the proportion of actual negatives that are correctly identified. In the context of an ROC curve, as the sensitivity increases (more true positives are identified), specificity typically decreases (more false positives occur), and vice versa, creating a trade-off between the two measures.
What does the area under the ROC curve (AUC) indicate about a test's performance?
-The area under the ROC curve (AUC) is a measure of the overall performance of the test. It ranges from 0 to 1, with an AUC of 1 indicating perfect discrimination (all true positives are ranked higher than any false positives), while an AUC of 0.5 indicates no discrimination ability (equivalent to random guessing). A higher AUC value indicates a better performing test.
Why is the specificity represented as 1 minus specificity on the ROC curve graph?
-The specificity is represented as 1 minus specificity to transform the graph from an inverse relationship between sensitivity and specificity to a direct relationship. This transformation makes it easier to interpret the graph, as both sensitivity and 1 - specificity increase together, allowing for a clearer visual representation of the test's performance.
How does the position of the decision threshold affect the sensitivity and specificity of a test?
-The position of the decision threshold directly affects the balance between sensitivity and specificity. If the threshold is set low, more cases will be classified as positive, increasing sensitivity (true positives identified) but also increasing false positives. Conversely, if the threshold is set high, fewer cases will be classified as positive, increasing specificity (true negatives identified) but potentially missing more true positives (increasing false negatives).
What are the general interpretations of AUC values in the context of test performance?
-AUC values are generally interpreted as follows: an AUC of 0.9 to 1.0 is considered excellent, indicating high accuracy in distinguishing between the two groups. An AUC of 0.8 to 0.9 is considered good, 0.7 to 0.8 is fair, and an AUC below 0.7 is considered poor or a failure, indicating that the test does not perform well in distinguishing between the groups.
How does the concept of ROC curves apply to medical tests?
-In medical testing, ROC curves are used to evaluate the effectiveness of a diagnostic test. By plotting the true positive rate against the false positive rate at various threshold levels, healthcare professionals can determine the best cut-off point for a test that balances sensitivity and specificity, thereby optimizing the test's ability to correctly diagnose patients.
What is the historical origin of ROC curves and how were they initially used?
-ROC curves originated from World War II radar signal detection theory. They were initially used to help radar operators distinguish between enemy signals (true positives) and noise (false positives). The term 'receiver operating characteristic' comes from the fact that these operators were called 'receiver operators', and the curves characterized their performance in signal detection.
How can you compare two different tests using ROC curves?
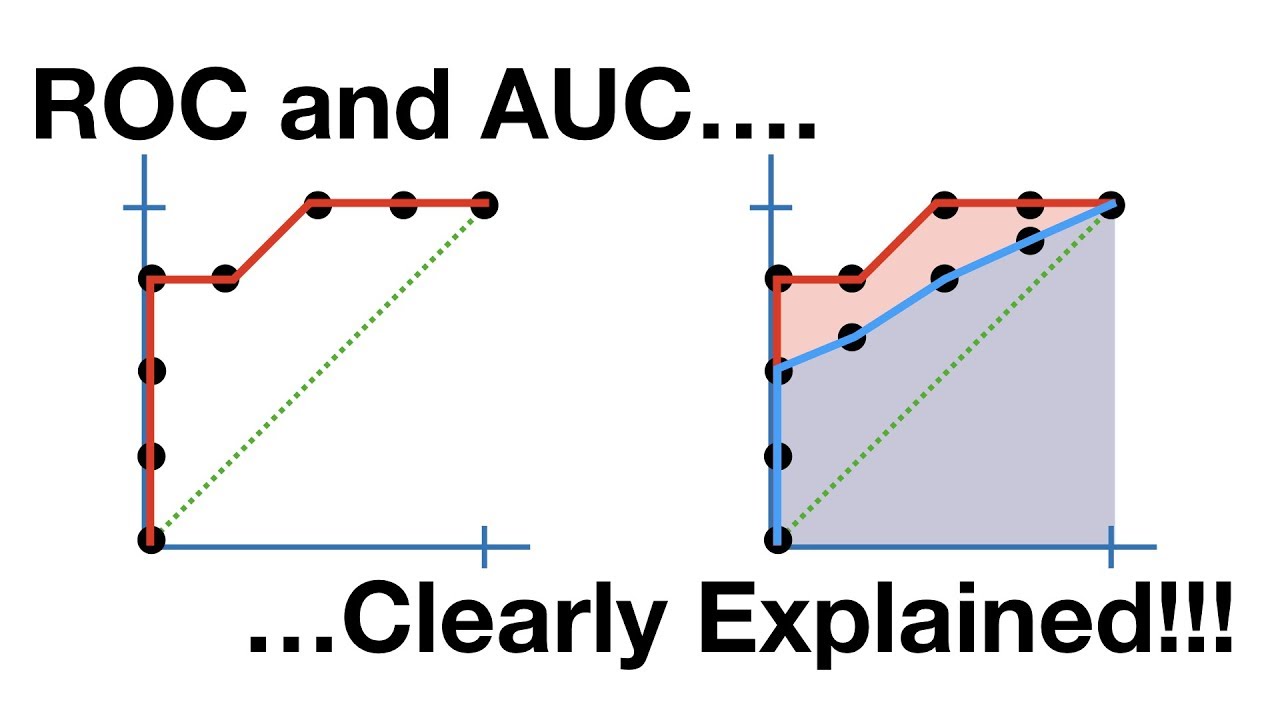
-To compare two different tests using ROC curves, you can look at the shape of the curves and the area under each curve (AUC). A test with a curve that is higher and more to the left (closer to the top left corner of the graph) is considered better, as it indicates a higher true positive rate and a lower false positive rate. Comparing the AUC values of the two tests can also provide a direct comparison of their overall performance.
What does the overlap in the distributions of patients with and without disease indicate in the context of test performance?
-The overlap in the distributions of patients with and without disease indicates the difficulty in distinguishing between the two groups using the test. Greater overlap suggests that the test is less effective at differentiating between true positives and false positives, leading to a less accurate diagnosis.
How does the concept of a cut-off value in a test relate to determining test results as positive or negative?
-The cut-off value in a test is the threshold that determines whether a test result is considered positive or negative. Patients who score above the cut-off value are classified as positive, while those below are classified as negative. Choosing the appropriate cut-off value is crucial for balancing sensitivity and specificity to ensure accurate test results.
Outlines
🧪 Introduction to Receiver Operating Characteristic (ROC) Curves
This paragraph introduces the concept of ROC curves, which are graphical representations used to evaluate the performance of a medical test. It explains how ROC curves illustrate a test's ability to distinguish between two groups, such as those with and without a disease. The paragraph also revisits the concepts of sensitivity and specificity from a previous video, using hypothetical test score distributions to demonstrate how these measures relate to the test's accuracy. The discussion includes the trade-off between sensitivity and specificity, and how adjusting the test's cut-off point affects these metrics. The paragraph sets the stage for a deeper exploration of ROC curves and their significance in medical testing.
📊 Understanding and Comparing ROC Curves
This paragraph delves into the specifics of interpreting ROC curves. It describes how different tests with varying levels of accuracy can be represented by the area under the ROC curve (AUC), which ranges from 0 to 1. The AUC indicates the test's ability to correctly identify true positives and true negatives. The paragraph uses hypothetical examples of four different tests, each with varying degrees of overlap in their distributions, to illustrate how the AUC reflects the test's distinguishing capabilities. It also explains the traditional way of graphing ROC curves by using 1 minus specificity, which inverts the relationship between sensitivity and specificity, allowing for a more intuitive interpretation of the test's performance. The paragraph concludes with general interpretations of AUC values, providing a framework for evaluating the excellence of a test.
📈 Historical Context and Application of ROC Curves
The final paragraph provides historical context for the use of ROC curves, tracing their origins to radar signal detection theory during World War II. It explains the role of 'receiver operators' in distinguishing between enemy signals and noise, which is analogous to the medical context of distinguishing between disease presence and absence. The paragraph highlights how the true positive and false positive rates of a receiver operator's decisions can be graphed to create an ROC curve, which then characterizes the operator's performance. It notes that the application of ROC curves to medical test results only began in the 1970s, demonstrating the adaptability of this analytical tool across different fields. The paragraph concludes by reiterating the utility of ROC curves in assessing and comparing the quality of medical tests.
Mindmap
Keywords
💡Receiver Operating Characteristic (ROC) Curve
💡Sensitivity
💡Specificity
💡True Positives
💡False Positives
💡True Negatives
💡False Negatives
💡Area Under the Curve (AUC)
💡Cutoff Point
💡Signal Detection Theory
💡Trade-off between Sensitivity and Specificity
Highlights
Receiver operator curves (ROC) are used to evaluate the performance of a test by determining how well it can distinguish between two groups, such as patients with and without a disease.
Sensitivity and specificity are key measures of a test's performance, where sensitivity is the proportion of true positives and specificity is the proportion of true negatives.
A test's cutoff point determines whether a result is considered positive or negative, affecting the balance between sensitivity and specificity.
ROC curves graph sensitivity on the y-axis and 1 minus specificity on the x-axis, creating a visual representation of a test's performance.
The area under the ROC curve (AUC) quantifies a test's ability to distinguish between positive and negative outcomes, with higher AUC values indicating better performance.
Different tests can be compared by examining their AUC values, with higher values indicating superior distinguishing properties.
The concept of ROC curves originates from World War II radar signal detection theory, where operator's ability to distinguish between true positives and false positives was crucial.
The term 'receiver operator' comes from the radar operators who needed to identify real signals from noise, which translates to the medical context as distinguishing between true positive and false positive results.
ROC curves were first applied in signal detection theory and later adapted for medical test interpretation in the 1970s.
A test with an AUC of 0.9 to 1 is considered excellent, while an AUC of 0.5 indicates a poor test with no distinguishing ability.
The trade-off between sensitivity and specificity is evident when adjusting the cutoff point, as increasing sensitivity decreases specificity and vice versa.
The distribution of test scores for patients with and without disease is represented visually, with the area under the curve representing true positives and the area outside representing false positives and true negatives.
The shape of the ROC curve provides insight into a test's ability to differentiate between positive and negative cases, with a curve filling more space indicating better performance.
The inverse relationship between sensitivity and specificity is transformed into a direct relationship when plotting 1 minus specificity on the ROC curve, allowing for easier comparison.
ROC curves enable the comparison of different tests by visually assessing which curve occupies a larger area under the ROC space, indicating superior discriminative properties.
An AUC value of 0.5 suggests that the test is no better than random chance at distinguishing between diseased and non-diseased patients.
The application of ROC curves in medicine represents a significant advancement in test evaluation, providing a standardized method for assessing and comparing diagnostic tests.
Transcripts
Browse More Related Video
ROC and AUC, Clearly Explained!

The ROC Curve (Receiver-Operating Characteristic Curve) — Topic 84 of Machine Learning Foundations

Finding the Area Under the ROC Curve — Topic 91 of Machine Learning Foundations
The tradeoff between sensitivity and specificity

Sensitivity and specificity - explained in 3 minutes

What Integral Calculus Is — Topic 85 of Machine Learning Foundations
5.0 / 5 (0 votes)
Thanks for rating: