The Velocity Problem | Part II: Graphically
TLDRThe video script explores the concept of velocity through a geometric perspective, using the example of a car's distance over time. It explains that average velocity is equivalent to the slope of a line on a graph, representing the change in distance over time. The script clarifies that regardless of the path taken, the average velocity over a specific interval is the same, represented by the slope of a secant line connecting two points on the graph. The video also delves into instantaneous velocity, which is the limit of average velocities as the time interval approaches zero. It illustrates that to find the exact speed at a specific moment, one must consider the slope of the tangent line at that point, which is obtained by shrinking the time interval indefinitely.
Takeaways
- 📈 The average velocity is represented by the slope of a line on a distance-time graph.
- ⏱️ The change in distance (ΔD) and the change in time (ΔT) determine the average velocity between two points.
- 🚗 The graph's straight line indicates constant velocity, with no acceleration or deceleration.
- 🔄 Different paths between two points can have varying velocities at different segments but the same average velocity over the entire interval.
- 📐 The concept of a secant line is introduced as a straight line between two points on a curve, representing the average velocity over that interval.
- 🔢 The average velocity is independent of the path taken and depends solely on the start and end points.
- 🏎️ A car's speed at a specific time can be thought of as the instantaneous velocity, which is the limit of the average velocity as the time interval approaches zero.
- 🌟 Instantaneous velocity is found by considering very small time intervals around the specific time of interest.
- 🧮 To calculate instantaneous velocity, one would theoretically need to continue decreasing the time interval indefinitely in a limiting process.
- 🔀 The slope of the secant line becomes an approximation for the instantaneous velocity as the time interval gets smaller and smaller.
- 📉 A shallower slope on the graph indicates slower velocity, while a steeper slope indicates faster velocity.
Q & A
What is the concept of average velocity in the context of the given script?
-Average velocity is the rate at which an object covers distance over a certain period of time. It is calculated as the change in distance divided by the change in time and, in the context of the script, it is also represented as the slope of a line (secant line) on a graph of distance versus time.
How does the graph represent a constant velocity?
-A constant velocity is represented on the graph as a straight line with a constant slope. This indicates that the object is moving at the same speed throughout the time interval, without acceleration or deceleration.
What is the significance of the slope of the secant line in determining average velocity?
-The slope of the secant line between two points on a distance-time graph represents the average velocity over that interval. Regardless of the shape of the graph between those points, the average velocity is the same as the slope of the line connecting them.
How can different paths on a distance-time graph result in the same average velocity?
-Different paths can result in the same average velocity if the total change in distance (delta D) over the total change in time (delta T) is the same for each path. This is because the average velocity is dependent on the starting and finishing points, not the path taken between them.
What is the concept of instantaneous velocity?
-Instantaneous velocity is the speed of an object at a specific point in time, as opposed to the average velocity over an interval. It is found by considering the limit of the average velocity as the time interval approaches zero, effectively looking at the slope of the tangent line to the graph at a particular point in time.
How does the concept of a secant line relate to the average velocity over an interval?
-A secant line is a straight line that connects two points on a curve. In the context of a distance-time graph, the slope of the secant line between two points represents the average velocity over the time interval between those points.
What would happen if we were to continuously decrease the time interval for calculating average velocity?
-As the time interval decreases, the secant line becomes closer to the tangent line at the point of interest. In the limit, as the interval approaches zero, the average velocity converges to the instantaneous velocity at that point.
Why does the average velocity remain constant for different intervals on a straight line graph?
-The average velocity remains constant on a straight line graph because the slope of the line, which represents the velocity, does not change. Therefore, no matter which intervals are chosen, the slope—and thus the average velocity—remains the same.
How can you determine the instantaneous velocity at a specific time, such as 2:15, using the graph?
-To determine the instantaneous velocity at a specific time like 2:15, you would look at the secant line that is very close to that time. As the interval approaches zero, the secant line becomes a tangent line, and its slope gives the instantaneous velocity at that point.
What is the difference between average velocity and instantaneous velocity?
-Average velocity is the total displacement divided by the total time taken over any interval, while instantaneous velocity is the velocity of an object at a specific instant in time. The latter is obtained by taking the limit of the average velocity as the time interval approaches zero.
Can you have a high average velocity with a non-linear path?
-Yes, it is possible to have a high average velocity with a non-linear path. The average velocity is determined by the total change in distance and total change in time, regardless of the path's curvature. Different segments of the path can have different velocities, and the overall average can still be high.
How does the shape of the distance-time graph affect the calculation of velocity?
-The shape of the distance-time graph does not directly affect the calculation of average velocity between two points, as the average velocity is determined by the slope of the secant line connecting those points. However, the shape of the graph does indicate how the velocity is changing over time, with steeper slopes indicating faster speeds and flatter slopes indicating slower speeds.
Outlines
📈 Understanding Average Velocity through a Geometric Approach
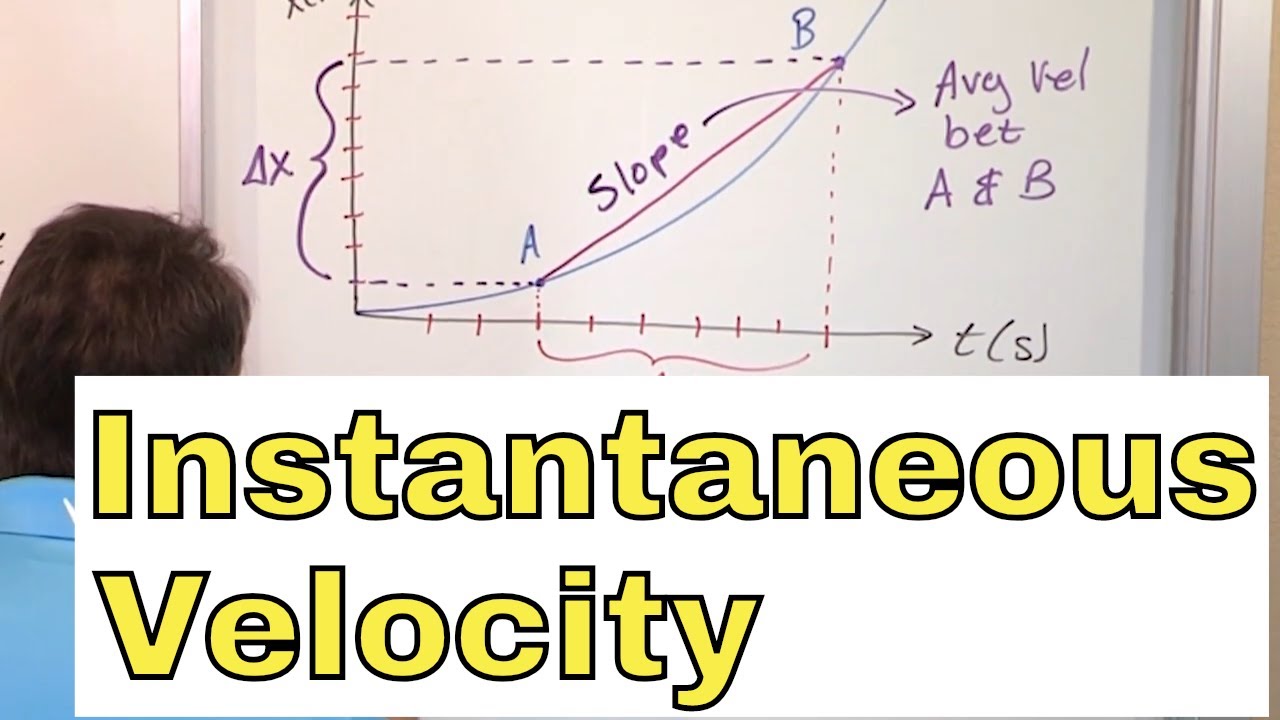
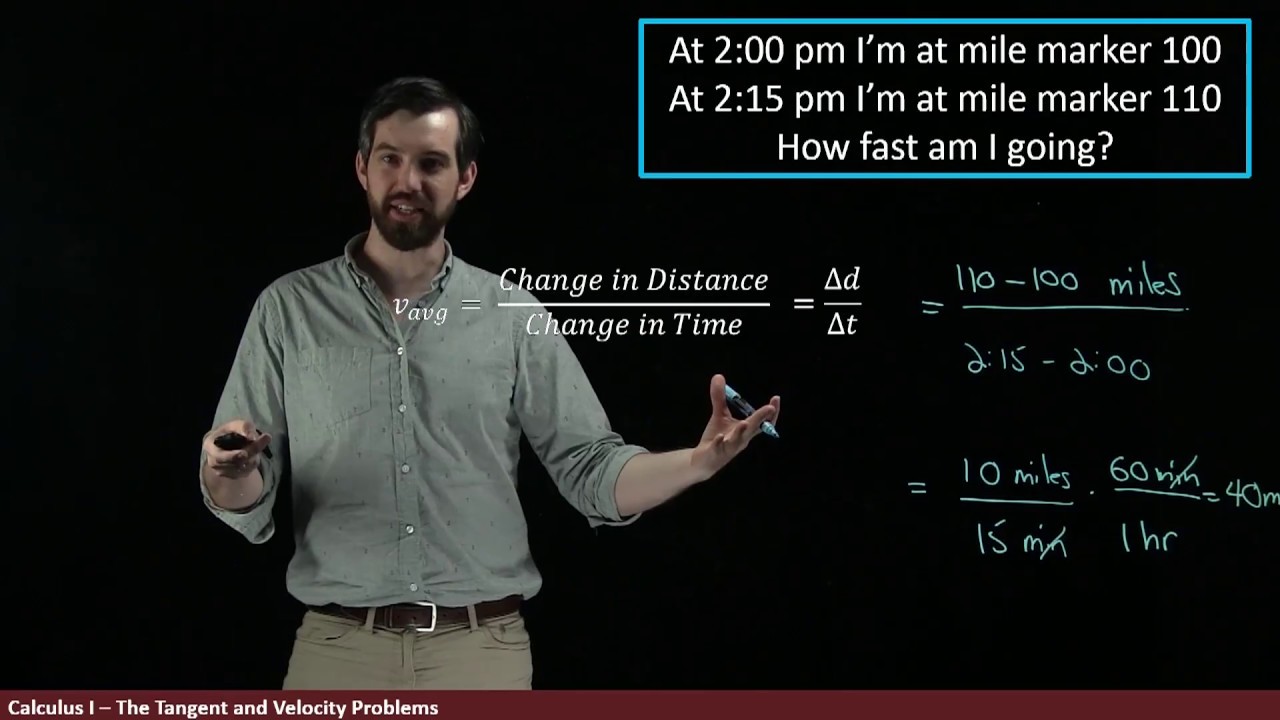
The first paragraph introduces the concept of average velocity by translating the problem into a geometric representation. It uses an example of a graph showing distance as a function of time. The car's position at 2 o'clock and 2:15 is marked on the graph, with a straight line representing the distance-time relationship. The average velocity is calculated by finding the slope of this line, which is determined to be 40 miles per hour. The paragraph emphasizes that the slope, or average velocity, remains constant regardless of the interval chosen on the graph, indicating a constant velocity. It also explores different paths the car could take, such as a piecewise linear path with varying velocities, but the average velocity over the entire interval remains the same at 40 miles per hour. The concept of a secant line is introduced as a method to calculate the average velocity over a specific interval, which is independent of the path taken by the car.
🏎️ Instantaneous Velocity and the Concept of Speed at a Specific Time
The second paragraph delves into the idea of instantaneous velocity, which is the velocity at a specific point in time, as opposed to the average velocity over an interval. It discusses how focusing on secant lines with increasingly smaller intervals around the point of interest, such as 2:15, can approximate the instantaneous velocity. The paragraph illustrates that as the time interval becomes smaller and smaller, the slope of the secant line converges to the slope of the tangent line at the point in question, which represents the instantaneous velocity. This process involves a limiting approach, where the interval is continually reduced to find the exact speed at a precise moment. The concept is further clarified by showing that the instantaneous velocity is not affected by acceleration or deceleration within the interval, only the net change from the start to the end of the interval.
Mindmap
Keywords
💡Velocity
💡Geometric Picture
💡Average Velocity
💡Slope
💡Secant Line
💡Instantaneous Velocity
💡Time Interval
💡Displacement
💡Piecewise Linear
💡Acceleration
💡Limiting Process
Highlights
The transcript explains the concept of translating velocity into a geometric picture using a graph of distance as a function of time.
An example graph is given where a car is at the 100-mile mark at 2:00 and at the 110-mile mark at 2:15.
The average velocity is calculated as the change in distance divided by the change in time, resulting in 40 miles per hour.
The average velocity is also described as the slope of the straight line representing the car's movement on the graph.
Different time intervals along the same line yield the same average velocity, demonstrating the consistency of the car's speed.
The concept of a secant line is introduced as a straight line between two points on a curve, representing the average velocity over that interval.
The average velocity over an entire graph is the slope of the secant line, regardless of the car's actual movement.
The transcript discusses piecewise linear paths and how they can be analyzed for different components of velocity.
Velocity measurements for different portions of the path are given, such as 72 miles per hour for a steeper slope and 16 miles per hour for a shallower slope.
The average velocity over the entire path, despite varying speeds, remains 40 miles per hour.
The importance of the starting and finishing points for calculating average velocity is emphasized.
The concept of instantaneous velocity is introduced as the limit of average velocity as the time interval approaches zero.
Instantaneous velocity is described as the slope of the tangent line at a specific point in time, as opposed to the secant line representing an interval.
The transcript illustrates how to find the instantaneous velocity at a specific time by considering very small intervals around that time.
A graphical representation is used to show how the slope of the secant line approaches the slope of the tangent line as the interval shrinks.
The process of finding instantaneous velocity involves a limiting process of continually decreasing the time interval.
The transcript concludes by emphasizing that average velocity provides a net change over an interval, while instantaneous velocity gives the speed at a precise moment.
Transcripts
Browse More Related Video
Average/Instantaneous Rates of Changes
07 - What is Instantaneous Velocity?, Part 1 (Instantaneous Velocity Formula & Definition)
Understanding Differentiation Part 2: Rates of Change

Intro to Derivatives, Limits & Tangent Lines in Calculus | Step-by-Step
The Velocity Problem | Part I: Numerically

Business Calculus - Math 1329 - Section 2.1 - The Derivative
5.0 / 5 (0 votes)
Thanks for rating: