Math Test Practice Test [ 30 Minutes ] Math for Business and Economics
TLDRThe transcript appears to be a detailed mathematical lecture, focusing on various calculus concepts such as finding critical values, intervals of increase or decrease, local maxima and minima, concavity, and inflection points. The lecturer guides through solving problems involving derivatives and integrals, applying these concepts to functions. They also cover the calculation of the equation of a tangent line at a specific point on a curve, the Gini index as a measure of inequality, and the area bounded by two curves. The explanation emphasizes the importance of understanding the signs of derivatives to determine the behavior of functions and the use of integral calculus to find areas and slopes. The lecture is highly instructional, providing step-by-step methods to solve complex mathematical problems.
Takeaways
- 📌 To find critical values, set the first derivative of a function to zero and solve for x.
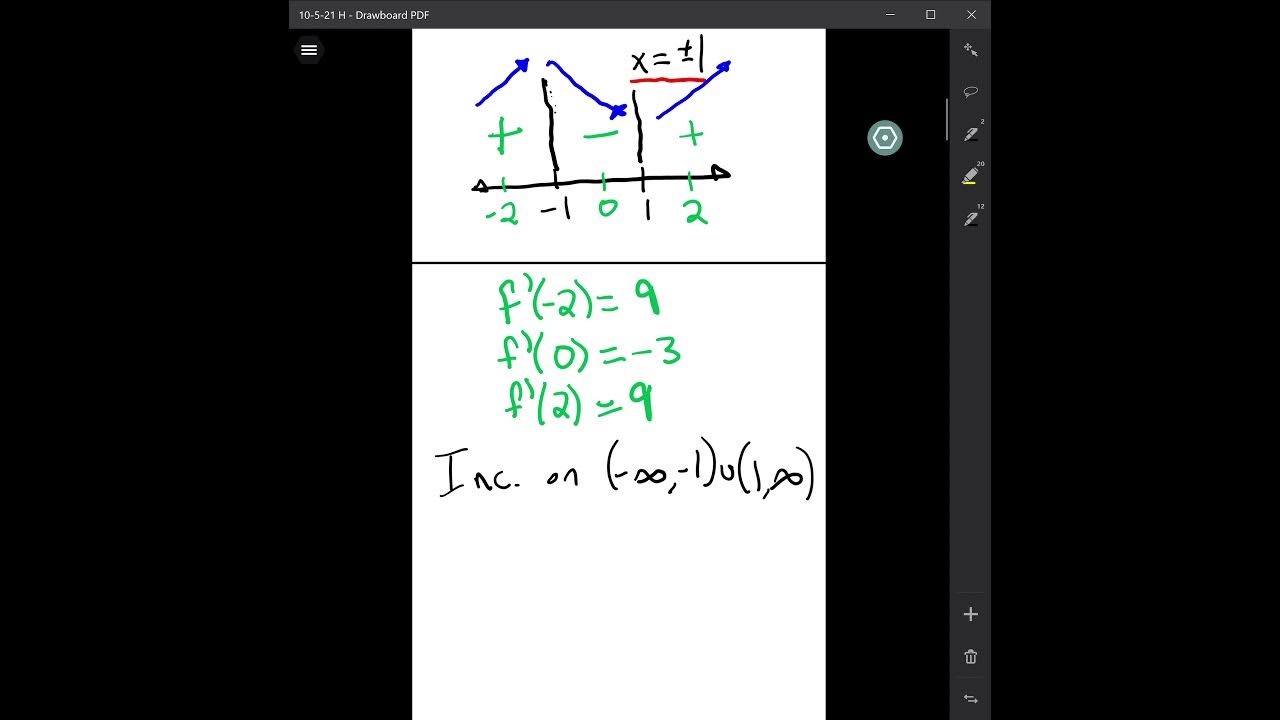
- 🔍 After finding critical values, evaluate the function's behavior (increase or decrease) in the intervals around these values.
- 📈 To determine if a point is a local maximum or minimum, analyze the change in sign of the first derivative around the critical values.
- 🔢 For concavity analysis, calculate the second derivative of the function and find its critical values to identify inflection points.
- ↕️ The sign of the second derivative indicates the concavity of the function: positive indicates concave up, negative indicates concave down.
- 🏁 To find the equation of a tangent line at a specific point, calculate the derivative of the function to find the slope and then use the point-slope form of a line.
- 🧮 When calculating the Gini index, integrate the given function within the specified interval and simplify the result to find the value of the index.
- ⛳ To find the area bounded by two curves, find the points of intersection, determine which curve is above the other in the regions of interest, and then integrate.
- 🔄 Always ensure the area calculated is positive, as the area cannot be negative.
- 📐 For sketching functions or curves, understanding the function's behavior at critical points and points of inflection can help in graphing without necessarily plotting every point.
- 💡 When integrating functions to find areas or other values, remember to use the appropriate limits and be mindful of the function's domain and behavior within those limits.
Q & A
What is the process to find critical values of a function?
-To find critical values, you first calculate the first derivative (f') of the function. Then, you set f' equal to zero and solve for x to find the critical values.
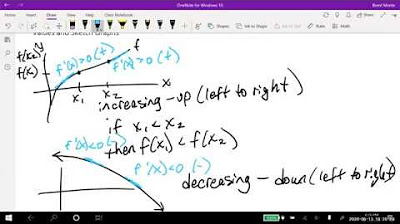
How do you determine the intervals of increase or decrease for a function?
-After finding the critical values, you test intervals around these points by plugging in values for x into the first derivative (f'). If f' is positive, the function is increasing; if f' is negative, the function is decreasing.
What does it mean when the sign of the first derivative changes?
-A change in the sign of the first derivative indicates a change in the direction of the function's slope, which can signify a local maximum or minimum.
How do you find the concavity of a function?
-To determine concavity, you first find the second derivative (f''). Then, you analyze the sign of f''. If f'' is positive, the function is concave up; if f'' is negative, the function is concave down.
What is an inflection point?
-An inflection point is a point on the curve where the concavity changes. It occurs when the second derivative is zero or undefined.
How do you find the equation of the tangent line to a curve at a given point?
-To find the equation of the tangent line, you first find the derivative of the function (slope of the tangent) at the given point. Then, you use the point-slope form of a line to write the equation of the tangent line.
What is the Gini index and how is it calculated?
-The Gini index is a measure of inequality among values of a frequency distribution. It is calculated by integrating the area between the Lorenz curve and the line of perfect equality, divided by the area under the line of perfect equality.
How do you determine the area bounded by two curves?
-To find the area bounded by two curves, you first find the points of intersection between the curves. Then, you integrate the absolute value of the difference of the two functions over the interval between these points.
What is the importance of sketching when analyzing functions?
-Sketching helps visualize the behavior of functions, such as their increasing/decreasing intervals, critical points, and concavity. It can aid in understanding and solving problems, especially for those who are not as comfortable with algebraic manipulation.
How do you handle a situation where the area under a curve is negative after integration?
-If the result of an integration yields a negative area, it should be taken as positive because the area under a curve cannot be negative. You can adjust the limits of integration or add a negative sign outside the integral to ensure the result is positive.
What is the significance of the first derivative test for critical points?
-The first derivative test is used to determine whether a critical point is a local maximum, local minimum, or neither. By analyzing the sign changes of the first derivative around the critical point, you can classify the nature of the point.
Why is it important to consider the sign of the second derivative when studying concavity?
-The sign of the second derivative (f'') indicates the concavity of the function. A positive second derivative indicates the function is concave up, while a negative second derivative indicates the function is concave down. This helps in understanding the overall shape of the function.
Outlines
📈 Calculating Critical Values and Analyzing Function Behavior
The first paragraph discusses the process of finding critical values of a function by setting its derivative to zero. It covers solving for critical values using factoring and substituting these values back into the function to determine intervals of increase or decrease. The speaker also explains how to identify local maxima and minima based on the behavior of the function's derivative.
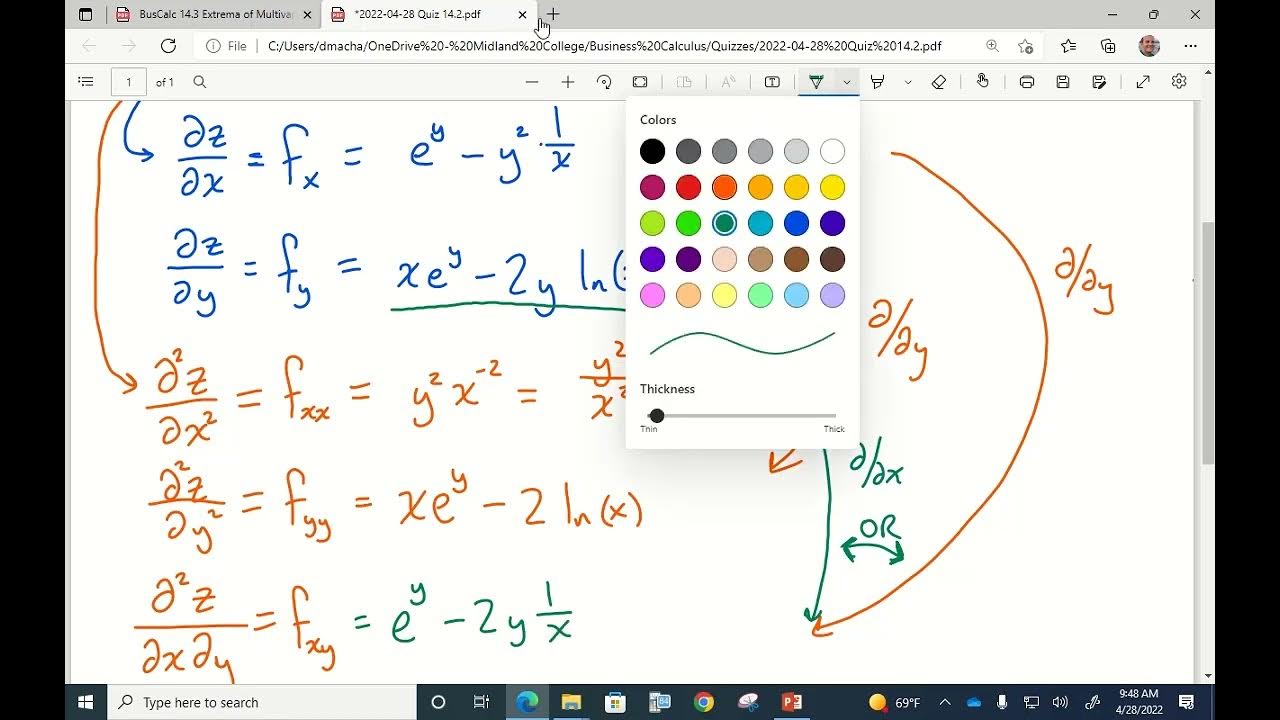
📌 Deriving and Analyzing Concavity and Inflection Points
The second paragraph focuses on the concept of concavity and inflection points. It explains how to find the first and second derivatives of a function and use them to determine critical values that may indicate inflection points. The speaker also demonstrates how to use these values to analyze the concavity of the function and locate inflection points accurately.
🔢 Calculating the Differential and Change in Function Values
The third paragraph deals with the calculation of the differential (d y) and the change in function values (delta f). It explains the process of finding the derivative of a function and using it to calculate the differential at a given point. Additionally, it covers how to find the change in function values between two points, emphasizing the use of delta x and the importance of understanding its role in both parts of the calculation.
🔍 Finding the Equation of a Tangent Line and Its Slope
The fourth paragraph is about finding the equation of the tangent line to a curve at a specific point. It details the steps to calculate the slope (m) of the tangent line by finding the derivative of the function at the point of interest. The speaker also shows how to find the y-coordinate (b) of the tangent line by substituting the x-value back into the original function and provides the final equation of the tangent line.
🧮 Computing the Gini Index and Simplifying Integrals
The fifth paragraph covers the calculation of the Gini index, a measure of inequality. It explains how to integrate the given function over a specific interval and simplify the expression before evaluating it. The speaker emphasizes the importance of accurate calculation and simplification to find the value of 'a' in the context of the Gini index formula.
🟥 Determining the Area Bounded by Two Functions
The sixth paragraph addresses the problem of finding the area bounded by two functions. It explains how to find the points of intersection between the functions and determine which function is above the other over specific intervals. The speaker demonstrates the process of integrating the difference between the functions to find the area and emphasizes the importance of ensuring the area is always a positive value.
📝 Correcting Errors in Integration and Finalizing the Total Area
The seventh and final paragraph corrects a potential mistake in the integration process and finalizes the calculation of the total area bounded by the two functions. It reinforces the concept that the area should not be negative and shows how to adjust the calculation if an error is made. The speaker confirms that the total area calculated is correct and invites any questions for clarification.
Mindmap
Keywords
💡Derivative
💡Critical Values
💡Factoring
💡Quadratic
💡Intervals of Increase and Decrease
💡Local Maximum and Minimum
💡Concavity
💡Inflection Point
💡Differential
💡Gini Index
💡Integration
Highlights
Derivation of a quadratic function is discussed, focusing on finding critical values by setting the first derivative to zero.
The process of factoring is chosen over the quadratic method for solving critical values, simplifying the equation to find x values.
Critical values are identified as x equals one and three, which are used to determine the intervals of increase or decrease for the function.
The behavior of the function is analyzed by substituting values into the first derivative to determine the sign and thus the intervals of increase or decrease.
The concept of local maximum and minimum is explored, with an emphasis on differentiating between a point and a value.
The second derivative is introduced to determine concavity, with the critical value found by setting the second derivative to zero.
The importance of the second derivative's sign is explained in determining the concavity of the function.
An inflection point is identified at x equals minus three, and the corresponding y value is calculated to complete the point.
The calculation of the differential, d y, is explained in terms of the derivative and the given x value.
The concept of delta f, or change in y, is introduced, with an explanation of how to calculate it using the function and given x values.
The equation of a tangent line to a curve is derived using the slope of the curve at a given x value.
The Gini index is calculated using an integral formula, with an emphasis on the correct integration and evaluation of the function.
The area bounded by two functions is determined by finding the points of intersection and evaluating the integral over the determined intervals.
The importance of keeping the area bounded by two functions as a positive value is highlighted, with a correction method if a negative value is obtained.
The method of sketching functions to determine which function is above or below is mentioned, with a note on the skills required for this approach.
An alternative to sketching is presented, which involves calculating the integral of the difference between the two functions to determine the area.
The final calculation of the total area bounded by the two functions is shown, emphasizing the mathematical correctness and the avoidance of negative areas.
Transcripts

5.0 / 5 (0 votes)
Thanks for rating: