Business Calculus -- Math 1329 - Project: Exploring Price-Demand & Revenue, Cost, and Profit Graphs
TLDRThe video script offers a comprehensive guide on using GeoGebra to explore economic concepts such as price demand, revenue, cost, and profit through graphical representation. The presenter begins by introducing GeoGebra and addressing potential challenges for new users. The tutorial covers entering the price demand function, adjusting the graph window for visibility, calculating demand at a specific quantity, and marking points and labels on the graph. It proceeds to adding text for clarity and customizing the graph's appearance, including title and color settings. The script also details how to save and export the graph as an image for inclusion in documents like Word. Further, it explains adding revenue and cost functions, finding intersection points for break-even analysis, and adjusting graph aesthetics. The presenter emphasizes the importance of understanding GeoGebra for future projects and encourages seeking help from the GeoGebra website or through direct communication for additional assistance.
Takeaways
- 📈 Start by entering the price demand function (P of X = 16 - 0.02X) in GeoGebra to generate the initial graph.
- 🔍 Adjust the graph window to display the correct ranges (X from -150 to 1000 and Y from -6 to 20) for the price demand function.
- ✅ Use algebraic notation (e.g., P(270)) in GeoGebra to find the price for a specific quantity, like the price for 270 wineglasses.
- 📌 Add points on the graph by typing the coordinates or using function notation (e.g., (270, P(270))) to represent specific quantities and prices.
- 🖌 Customize the appearance of text and labels in the graph by changing color, size, and style through the settings menu.
- 📑 To include the graph in a Word document, export the graph as an image and paste it into the document.
- 🔗 Use function names (P of X, R of X, etc.) consistently to avoid confusion and ensure GeoGebra recognizes the correct functions.
- 🧮 The revenue function is calculated as R of X = X * P of X, and the cost function is represented as C of X = 1200 + 3.6X.
- 📊 Profit function is denoted as PR of X and is calculated as R of X - C of X to find the profit at different points.
- ⚙️ Adjust the graph settings to display only the necessary functions (revenue, cost, and profit) and to set the appropriate scaling.
- 🔗 Find the break-even point by using the intersect feature on the revenue and cost functions and label the points with their values.
- 💡 GeoGebra offers a lot of help and resources on their website for further assistance and understanding of its functions.
Q & A
What is the main topic of the video?
-The video is about exploring price demand, revenue, cost, and profit graphs using GeoGebra, a mathematical software tool.
Why might the graph of the price demand function not be visible initially?
-The graph might not be visible because it is outside the current viewing window of GeoGebra, which is a common issue when working with the software.
How does one adjust the viewing window in GeoGebra?
-To adjust the viewing window, you hover near the x or y-axis, press shift and click and hold, then drag to expand or contract the view in the desired direction.
What is the price demand function given in the video?
-The price demand function given is P(X) = 16 - 0.02X.
How can you find the demand when selling a specific quantity, like 270 wineglasses?
-In GeoGebra, you can find the demand by entering the function name followed by the specific quantity in parentheses, such as P(270).
How do you add a point on the graph in GeoGebra?
-To add a point, you type in the coordinates starting with a left parenthesis, include the x value, use 'P of' for the y value to let GeoGebra compute it, and close with a right parenthesis.
What is the process to add text to a graph in GeoGebra?
-To add text, you select the 'text' option from the menu, click on the graph where you want the text to appear, type the desired text, and press ENTER. You can then format the text, such as changing the color and size.
How can you save your work in GeoGebra?
-You can save your work by going to the hamburger menu (three lines), and selecting 'save'. It's recommended to create an account for easier saving and access.
What is the formula for revenue in terms of the price demand function and quantity?
-The revenue function is calculated as R(X) = X * P(X), where X is the quantity and P(X) is the price demand function.
How do you export a graph from GeoGebra to a Word document?
-You can export the graph by going to the hamburger menu, selecting 'export image', copying the image, and pasting it into a Word document. Alternatively, you can download the image as a PNG file and insert it into Word.
What is the process to find the break-even point in GeoGebra?
-To find the break-even point, you use the 'intersect' tool from the point menu to find the intersection of the revenue and cost functions, which indicates the break-even point.
Why is it important to understand the mechanics of GeoGebra for this project?
-Understanding GeoGebra is important because the project is designed to be instructive and didactic, helping users engage with the graphs, see how they change, and understand how the curves work with each other. Additionally, there will be more GeoGebra projects in the future.
Outlines
📈 Introduction to GeoGebra for Price Demand Functions
The video begins with an introduction to using GeoGebra, a dynamic mathematics software, to explore intricate aspects of price demand, revenue, cost, and profit graphs. The focus is on entering the price demand function P(X) = 16 - 0.02X and adjusting the graph window to display the function correctly. The presenter demonstrates how to find the price for 270 wineglasses using algebraic methods within GeoGebra and how to add points and labels to the graph for clarity. The process of adding text to the graph to indicate the value of the wine class is also covered, along with tips for adjusting text formatting for better visibility.
🎨 Customizing Graph Aesthetics and Exporting
The presenter continues by showing how to customize the graph's aesthetics, such as changing the color and size of text labels and moving them to avoid covering the graph. The title of the graph is added, and its formatting is adjusted for better legibility. The video then covers the process of saving the GeoGebra project and exporting the graph as an image to be used in a Word document. The presenter also revisits the revenue function, emphasizing the importance of using function names like P(X) and R(X) to ensure GeoGebra can reference them later.
📊 Analyzing Revenue, Cost, and Profit Functions
The video moves on to discuss the revenue function R(X), which is the product of the price demand function and the quantity (X). The presenter then introduces the cost function C(X) and the profit function PR(X), which is the difference between revenue and cost. The challenge of setting the correct graph window to visualize all functions is addressed, and the presenter shows how to adjust the window to display the revenue, cost, and profit functions effectively. The presenter also explains how to turn off the price demand function when it's not needed and how to change the color of the revenue function for better distinction. The process of finding the break-even point by identifying the intersection of the revenue and cost functions is demonstrated, along with how to adjust the labels of the intersection points to display their values.
🔍 Engaging with GeoGebra for a Deeper Understanding
The final paragraph emphasizes the importance of engaging with GeoGebra to understand how different graphs and curves interact with each other. The presenter encourages viewers to grasp the mechanics of GeoGebra early in their learning process, as more projects will be assigned in the future. The video concludes with a reminder that the project is not just about creating graphs but also about learning from the process. The presenter offers additional support via email and suggests looking up help on the GeoGebra website or searching online if needed.
Mindmap
Keywords
💡GeoGebra
💡Price Demand Function
💡Graph Window
💡Algebraic Expression
💡Revenue Function
💡Cost Function
💡Profit Function
💡Break-even Point
💡Graph Manipulation
💡Labeling Points
💡Exporting Graphs
Highlights
Introduction to GeoGebra for creating graphs and visualizing economic functions.
Entering the price demand function P(X) = 16 - 0.02X in GeoGebra.
Adjusting the graph window to visualize the price demand function properly.
Calculating the demand for 270 wineglasses using the function P(270).
Adding a point on the graph to represent a specific quantity and price.
Inserting text labels on the graph to indicate prices.
Customizing text formatting, including color, size, and style.
Moving and positioning text labels for better clarity on the graph.
Adding a title to the graph for context.
Saving and exporting the graph as an image for inclusion in documents.
Entering the revenue function R(X) = X * P(X) and simplifying it.
Defining the cost function C(X) and the profit function PR(X) = R(X) - C(X).
Adjusting the graph window to display revenue, cost, and profit functions correctly.
Identifying and graphing the break-even point by finding the intersection of revenue and cost functions.
Customizing the appearance of functions on the graph, such as changing colors and labels.
Tips for evaluating the graph to ensure all necessary information is visible.
GeoGebra's resources for help and tutorials for users who get stuck.
Emphasis on the importance of understanding GeoGebra for future projects and engaging with economic graphs.
Transcripts
Browse More Related Video
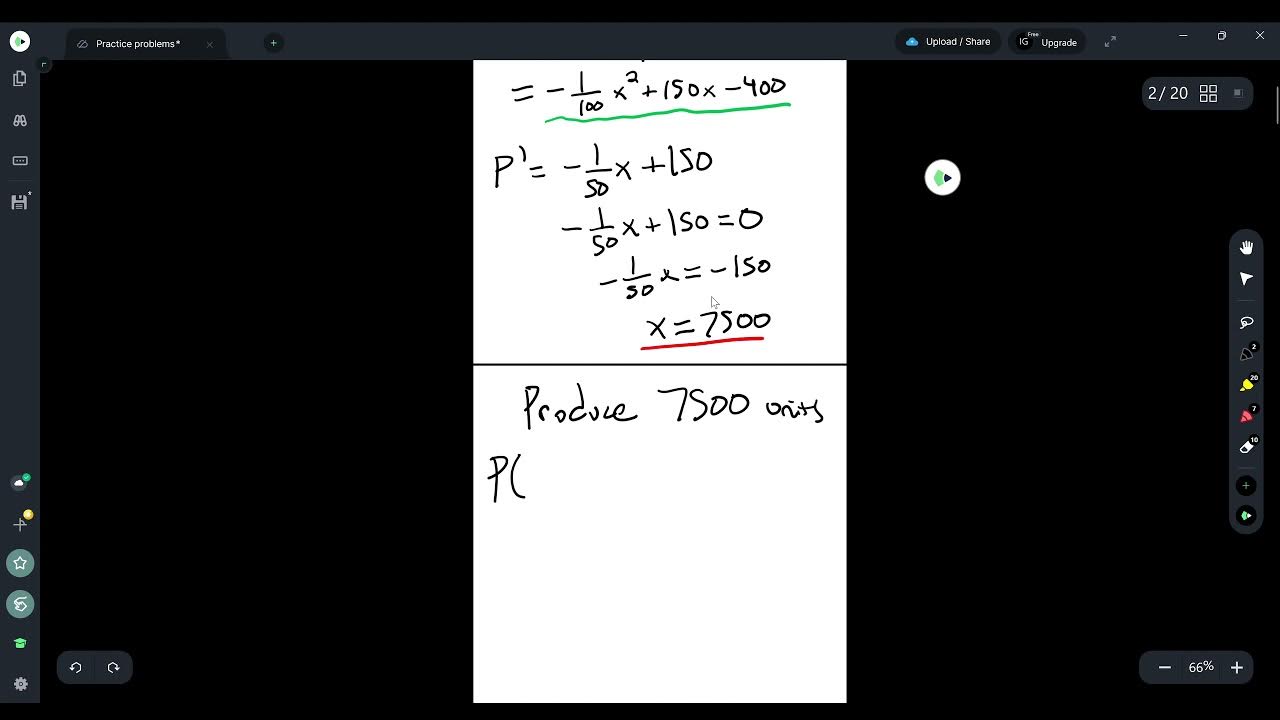
Optimization Problem Examples
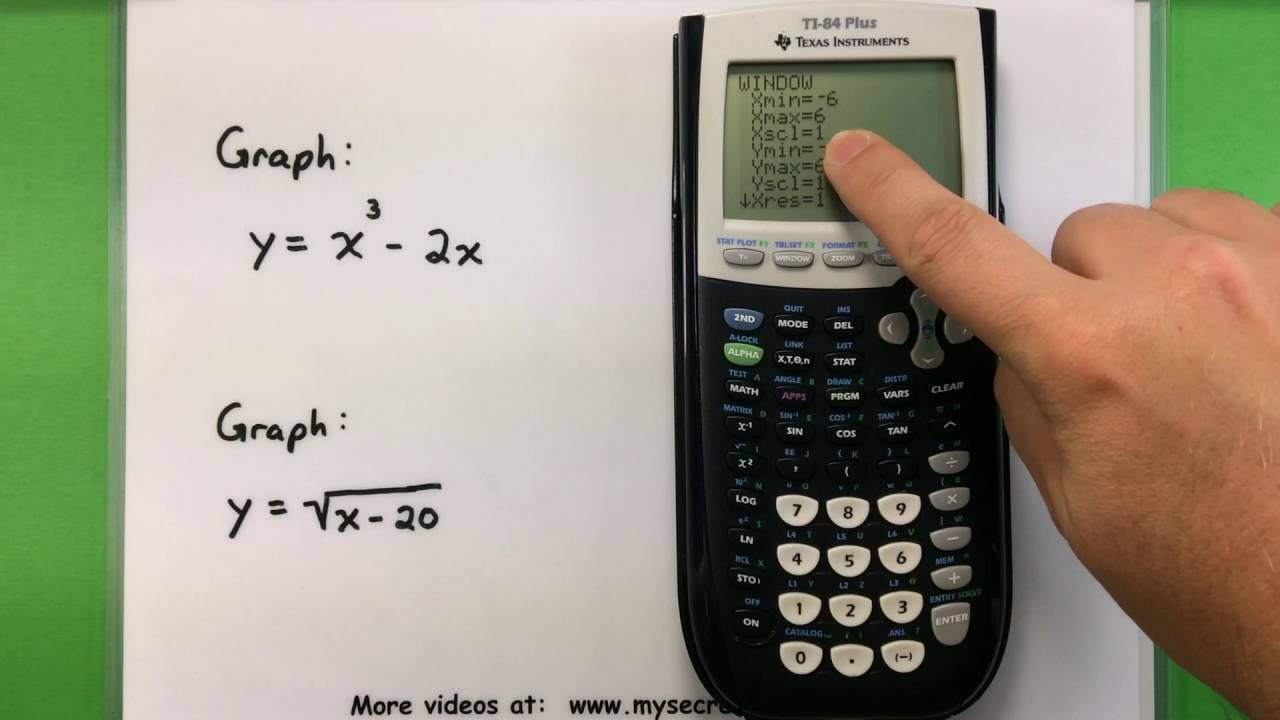
Basic Math - Graphing with a Ti-83 or Ti-84 Calculator
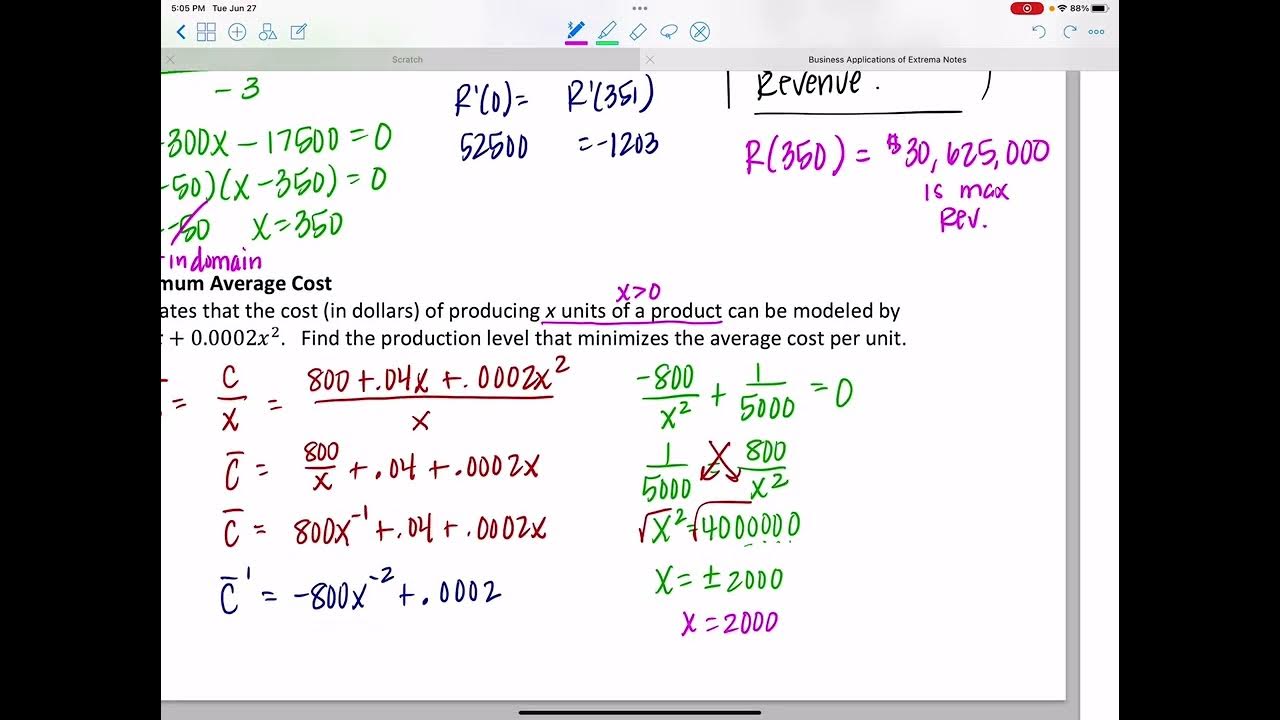
Business Applications of Extrema
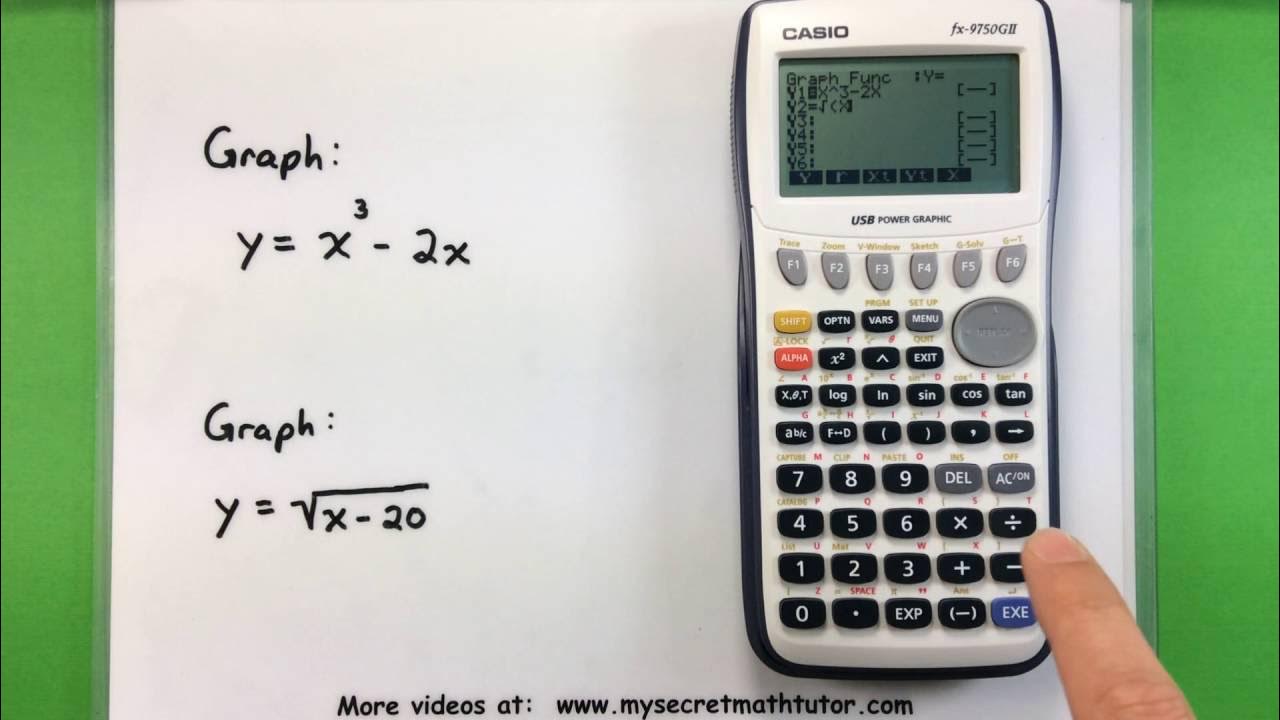
Basic Math - Graphing with a Casio fx-9750GII Calculator
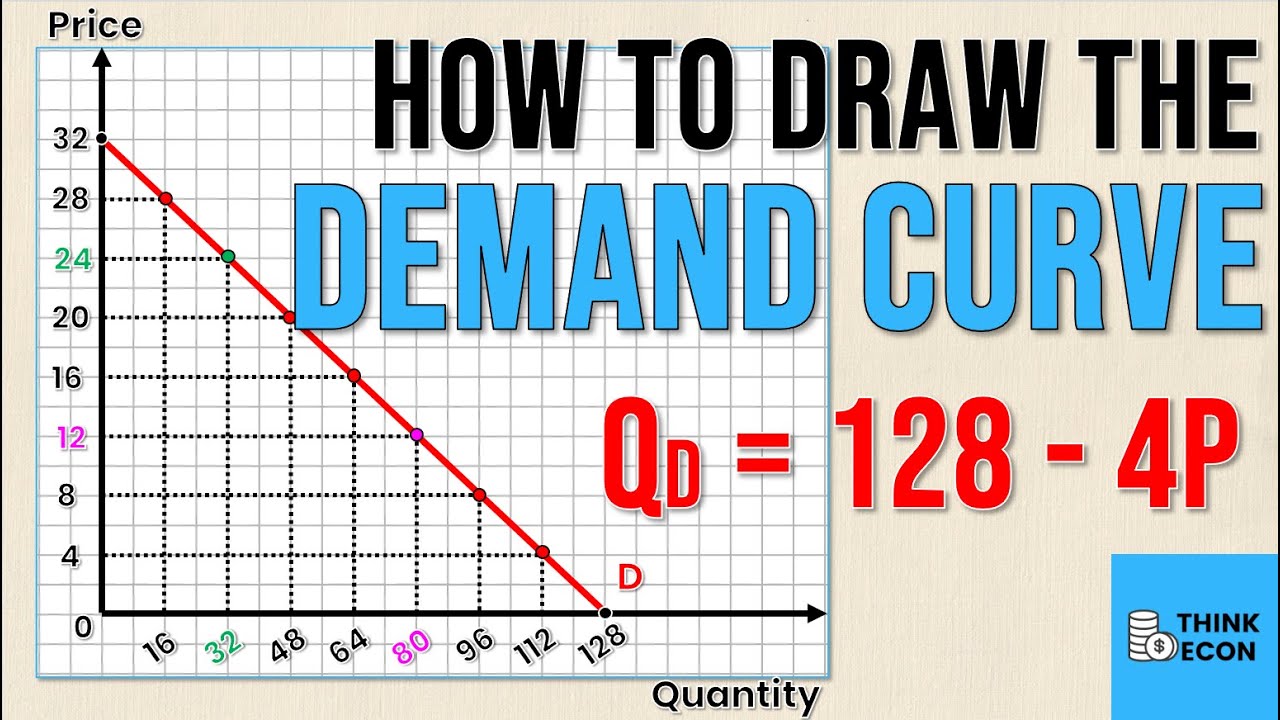
How to Draw the DEMAND CURVE (Using the DEMAND EQUATION) | Think Econ
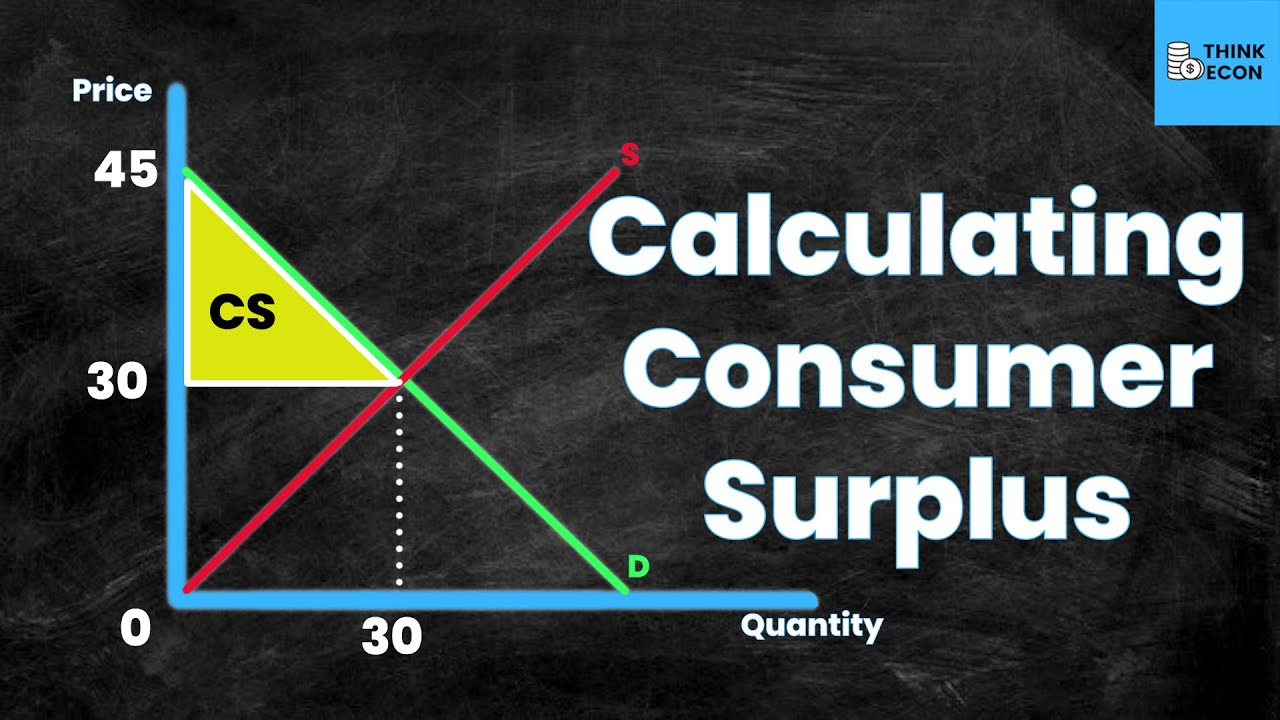
How to CALCULATE Consumer Surplus [WITH EXAMPLE] | Think Econ | Microeconomic Concepts
5.0 / 5 (0 votes)
Thanks for rating: