AP Physics Workbook 1.L Linearizing Graphs
TLDRThe video script discusses an AP Physics problem where students Angelika and Carlos use a stopwatch and spheres to determine the acceleration due to gravity. They collect data on the height and time for a ball falling from various heights and plot a position-time graph. The key concept explained is linearizing a graph by squaring the time values to transform the parabolic relationship into a linear one, allowing for easier analysis. The video demonstrates how to calculate the slope of the best-fit line from the transformed data to determine gravity's acceleration.
Takeaways
- 📈 The video discusses linearizing a graph, specifically focusing on the relationship between drop height and time to fall to determine acceleration due to gravity.
- 🔍 Angelika and Carlos use a stopwatch, spheres, and a meter stick to collect data on the drop height and time for various heights.
- 🌐 The collected data is plotted on a position-time graph, revealing a parabolic shape that needs to be transformed into a linear relationship.
- 📊 By plotting the square of the time (x-axis) against the drop height (y-axis), the graph becomes linear, allowing for easier analysis.
- 🏆 The key to linearization is understanding the mathematical relationship between the variables and transforming them appropriately (squaring or square rooting).
- 📝 The video emphasizes the importance of proper scaling and labeling of axes when graphing to ensure accuracy and readability.
- 🔢 The slope of the line of best fit on the linearized graph is used to calculate the acceleration due to gravity.
- 🎯 To find the acceleration due to gravity, the slope of the best fit line is multiplied by 2, as the relationship is proportional to half of gravity.
- 💡 The process demonstrated in the video is not only applicable to physics but can be used in various scientific fields where linear relationships are beneficial for analysis.
- 🌟 The video highlights four types of relationships: direct proportion, inverse proportion, quadratic, and square root, and how they can be transformed for easier interpretation.
- 🚀 Understanding and applying these transformations is crucial for simplifying complex relationships and making them more manageable for scientific study.
Q & A
What are Angelika and Carlos trying to determine using a stopwatch, spheres, and a meter stick?
-Angelika and Carlos are trying to determine the acceleration due to gravity by measuring the drop height and the time it takes for the ball to fall from several different heights.
What is the significance of the position-time graph in this experiment?
-The position-time graph helps visualize the relationship between the height (drop height) and the time it takes for the ball to fall. By observing the shape of the graph, they can identify the type of relationship, which in this case appears to be quadratic.
How does the shape of the graph indicate the relationship between height and time?
-The graph's shape, which looks like a parabola, indicates that the height (drop height) is proportional to the square of the time, suggesting a quadratic relationship.
What is the purpose of squaring the time values in the experiment?
-Squaring the time values is a method to linearize the graph, making it easier to identify and calculate the relationship between the height and time, which helps in determining the acceleration due to gravity.
What are the four types of relationships mentioned in the script?
-The four types of relationships mentioned are direct proportionality (y = kx), inverse proportionality (y = 1/x), and two types of quadratic relationships (y = x^2 and y = sqrt(x)).
How do you linearize a graph that is not linear?
-To linearize a graph, you can either square both x and y values or take the square root of both x and y values, depending on the initial relationship. This process transforms a quadratic relationship into a linear one.
What is the line of best fit used for in this context?
-The line of best fit is used to determine the acceleration due to gravity. By calculating the slope of this line from the linearized graph, and knowing that it represents half of gravity, you can solve for the full gravitational acceleration.
How do you calculate the slope of the line of best fit?
-The slope of the line of best fit is calculated using the slope formula, which involves the difference in y-values divided by the difference in x-values of two points on the line.
Why is it important to scale the graph properly?
-Proper scaling of the graph is crucial for accurate data representation and analysis. It ensures that all data points can be clearly seen and that the relationships between variables can be accurately determined.
What is the significance of understanding the mathematical relationship between variables in this experiment?
-Understanding the mathematical relationship between variables is key to identifying the type of relationship (linear, quadratic, direct proportional, inverse proportional, etc.) and applying the correct method to linearize the graph and solve for the desired physical quantity, such as gravitational acceleration.
Outlines
📈 Introduction to Linearizing Graphs in AP Physics
This paragraph introduces the concept of linearizing graphs in the context of AP Physics. The scenario involves Angelika and Carlos using a stopwatch, spheres, and a meter stick to determine the acceleration due to gravity. They collect data on the drop height and time for different heights and plot a position-time graph. The main objective is to understand the relationship between the drop height and time, and how to represent this relationship in a linear fashion. The paragraph emphasizes the importance of graphing data accurately and identifying the correct physical quantities.
🔢 Calculating and Plotting Squared Values in Physics
The second paragraph delves into the process of calculating and plotting squared values in physics. It explains how to transform the time values (x-axis) by squaring them to create a linear relationship with the drop height (y-axis). The paragraph provides a step-by-step guide on squaring the time values and plotting them against the corresponding drop heights. It also touches on the concept of direct and inverse proportionality, and how these relationships can be represented graphically. The goal is to understand how squaring the time values can linearize the graph and make it easier to analyze the data.
📊 Linearizing the Graph and Determining Gravity
In this paragraph, the focus is on linearizing the graph to determine the acceleration due to gravity. It explains how to plot the points using the squared time values and the drop heights, and how to create a linear representation of the original parabolic data. The paragraph emphasizes the importance of proper scaling and labeling of axes when plotting graphs for the AP Physics exam. It concludes by demonstrating how to use the line of best fit to calculate the acceleration due to gravity, highlighting the mathematical relationship between the squared time and drop height, and the significance of understanding these relationships for solving physics problems.
Mindmap
Keywords
💡AP Physics
💡Linearizing a Graph
💡Acceleration due to Gravity
💡Position-Time Graph
💡Direct Proportion
💡Inverse Proportion
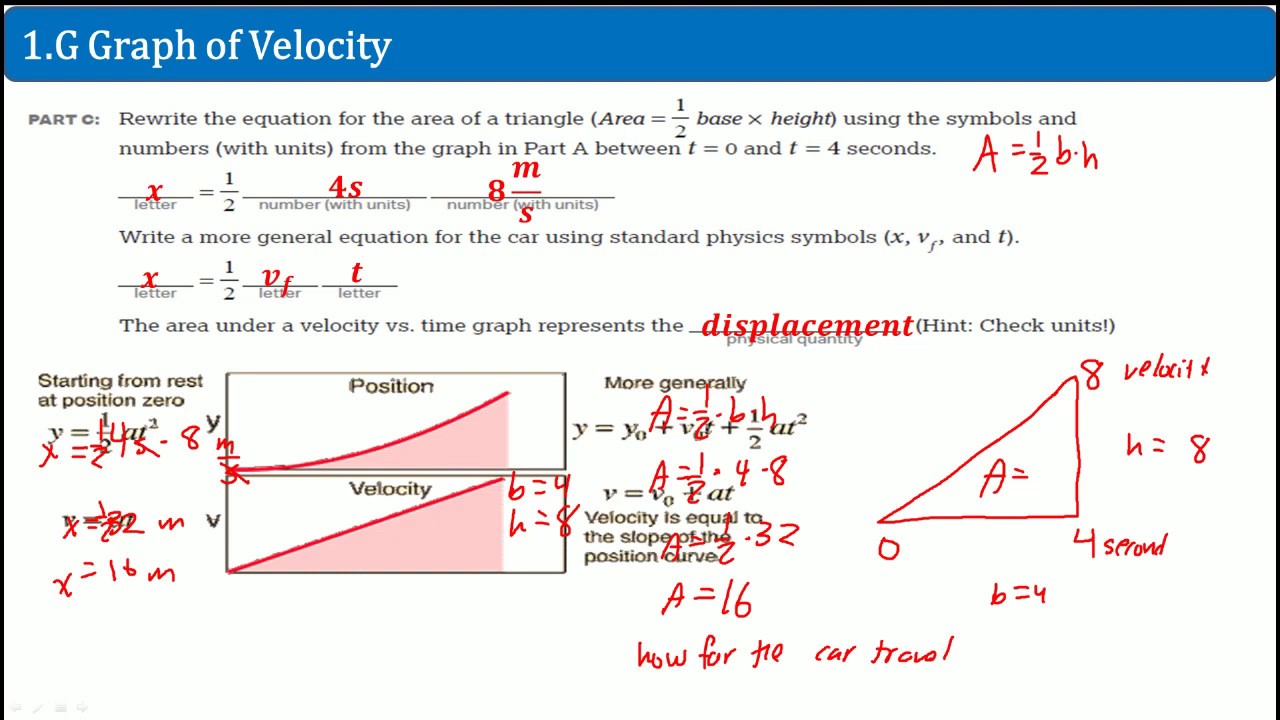
💡Displacement
💡Time Squared
💡Drop Height
💡Linear Regression
💡Scaling
Highlights
Angelika and Carlos are tasked with determining the acceleration due to gravity using a stopwatch, spheres, and a meter stick.
They decide to collect data by dropping the ball from several different heights and recording the time to fall.
A position-time graph is created based on the collected data, showing the height and time.
The graph indicates a relationship between the drop height and time, which can be analyzed further.
The shape of the graph suggests a parabolic relationship between height and time.
Displacement (drop height) is found to be proportional to the square root of time.
Different types of proportional relationships are discussed, such as direct proportionality (y = kx) and inverse proportionality (y = 1/x).
The concept of linearizing a graph is introduced to simplify the analysis of non-linear relationships.
By squaring the time values, the graph of drop height versus time can be linearized.
The linearized graph allows for easier determination of the acceleration due to gravity using the line of best fit.
The importance of proper scaling and labeling axes when graphing is emphasized for accurate analysis.
The process of calculating the slope of the line of best fit is explained to find the acceleration due to gravity.
It is noted that not all relationships are linear, and linearization techniques can be applied to better understand and analyze data.
The example demonstrates the mathematical relationship between displacement and time in the context of free-fall motion.
The concept of squaring or square rooting terms to transform quadratic relationships into linear ones is discussed.
Four types of relationships are mentioned, emphasizing the need to understand these to effectively linearize graphs.
Transcripts
Browse More Related Video


5.0 / 5 (0 votes)
Thanks for rating: