AP Physics Workbook 1.D Velocty Is a Vector
TLDRThe video script discusses the concept of velocity as a vector in physics, using a scenario with two characters, Angelica and Blake, running towards each other. It explains their positions at different times, showing how their velocities can be graphed and the calculation of their velocities. The script then addresses a student's claim about the intersection point on the position vs. time graph, clarifying that while Angelica and Blake share the same position at a certain time, their velocities differ due to their opposite directions of motion.
Takeaways
- 📌 Velocity is a vector quantity, which means it has both magnitude and direction.
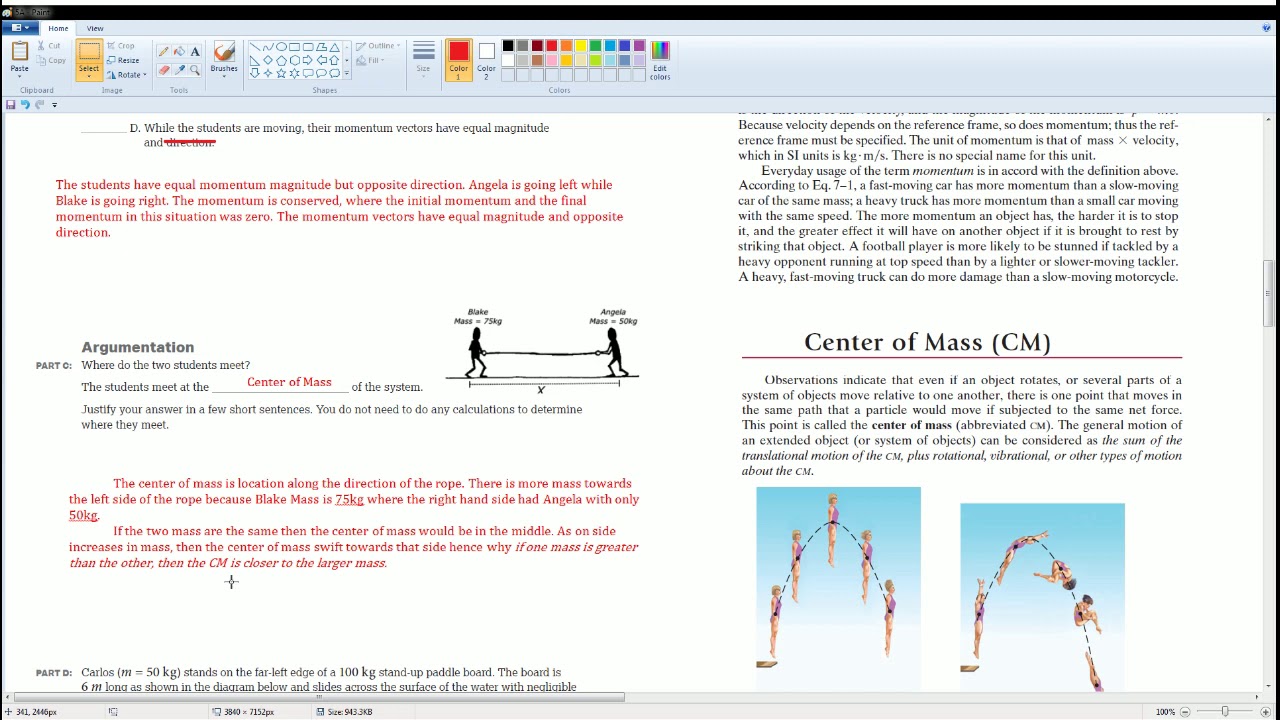
- 🏃♀️ Angelica and Blake are running towards each other from an initial distance of 15 meters.
- 🏃♂️ Angelica runs to the right at a constant speed of 5 meters per second, while Blake runs to the left at 3 meters per second.
- 📈 The position of the runners changes over time, which can be plotted on a graph to visualize their motion.
- 📊 A graph of position versus time for each runner shows that they get closer and their positions change as time progresses.
- 🔄 The intersection point on the position-time graph represents the time and position where Angelica and Blake meet.
- 🕒 At the time of intersection, which is at approximately 1.9 seconds, both runners are at the same position, 9.5 meters from the starting point.
- 🛣️ The velocities of Angelica and Blake are different at the intersection point; Angelica's velocity is +5 m/s, and Blake's velocity is -3 m/s.
- 📉 The slope of the position-time graph lines represents the velocity of the runners, with a positive slope for Angelica and a negative slope for Blake.
- 🤔 The students' claim that the runners have the same velocity at the intersection is incorrect, as their velocities are in opposite directions.
- 📝 Understanding the relationship between position, velocity, and time is crucial for solving problems in physics involving motion.
Q & A
What is the main concept being discussed in the video?
-The main concept discussed in the video is the vector nature of velocity and how it can be represented on a position versus time graph.
Who are the two characters running towards each other in the scenario?
-The two characters running towards each other are Angelica and Blake.
What are the initial positions of Angelica and Blake at time T equals zero?
-At time T equals zero, Angelica is at position 0 and Blake is at position 15.
What are the speeds and directions of Angelica and Blake?
-Angelica runs to the right at 5 meters per second, while Blake runs to the left at 3 meters per second.
How does the position of Angelica change over time?
-Angelica's position changes linearly over time, increasing by 5 meters each second due to her constant speed of 5 meters per second.
How does the position of Blake change over time?
-Blake's position changes linearly over time, decreasing by 3 meters each second because he is running to the left with a speed of 3 meters per second.
What does the slope of a position versus time graph represent?
-The slope of a position versus time graph represents velocity. A positive slope indicates motion to the right, while a negative slope indicates motion to the left.
What are the velocities of Angelica and Blake based on the graph?
-Angelica's velocity is 5 meters per second, and Blake's velocity is negative 3 meters per second, indicating they are moving in opposite directions.
At what time and position do Angelica and Blake have the same position on the graph?
-Angelica and Blake have the same position at 1.9 seconds, which is approximately 9.5 meters from the starting point.
Do Angelica and Blake have the same velocity at the time they intersect on the graph?
-No, they do not have the same velocity at the time they intersect. Angelica's velocity remains positive at 5 meters per second, while Blake's velocity is negative at negative 3 meters per second.
What is the significance of the intersection point on the position versus time graph?
-The intersection point on the position versus time graph represents the moment when the two objects are at the same position. However, it does not necessarily mean they have the same velocity, as their slopes on the graph can be different, indicating different rates of motion.
Outlines
📚 Introduction to Velocity as a Vector and Position vs. Time Graph
This paragraph introduces the concept of velocity as a vector in the context of a physics problem. It describes a scenario where two characters, Angelica and Blake, are running towards each other from a distance of 15 meters. Angelica runs to the right at 5 meters per second, while Blake runs to the left at 3 meters per second. The paragraph explains how to track their positions over time, using a graph to illustrate the changes. It also covers how to calculate the slope of the line for each character's position versus time graph, which represents their velocity. The explanation includes the use of specific points on the graph to determine the velocities of Angelica (5 m/s) and Blake (-3 m/s), highlighting the difference in their directions of motion.
🔍 Analyzing the Intersection Point and Velocities in the Graph
The second paragraph delves deeper into the analysis of the position versus time graph, focusing on the intersection point where Angelica and Blake's paths cross. It clarifies that while the intersection point represents the time and position where both characters are at the same place, their velocities are different. The paragraph emphasizes the distinction between Angelica's positive acceleration of 5 m/s, which causes her position to increase over time, and Blake's negative velocity of -3 m/s, indicating his position decreases over time. The explanation serves to correct the students' claim about the intersection point, providing a clear understanding of the relationship between position, velocity, and the slope of the position-time graph.
Mindmap
Keywords
💡Velocity
💡Vector
💡Position
💡Graph
💡Intersection
💡Acceleration
💡Slope
💡Time
💡Distance
💡Rate of Change
💡Position vs. Time Graph
Highlights
Velocity is a vector quantity, which means it has both magnitude and direction.
Angelica and Blake are running towards each other from an initial distance of 15 meters.
Angelica runs to the right at a speed of 5 meters per second, while Blake runs to the left at 3 meters per second.
At time equals zero, Angelica is at position zero and Blake is at position 15.
After the first second, Angelica's position is at 5 meters and Blake's position is at 2 meters.
The position of Angelica and Blake changes linearly with time, showing a constant rate of change.
A graph of position versus time for both runners can be used to visualize their motion.
The slope of the line on the position-time graph represents the velocity of the runners.
Angelica's velocity is calculated to be 5 meters per second using the points (0,0) and (1,5).
Blake's velocity is calculated to be negative 3 meters per second using the points (0,15) and (1,12).
The intersection point on the position-time graph represents the time and position where the two runners meet.
At the intersection, Angelica and Blake are at the same position, but their velocities are different due to their directions.
Angelica has a positive acceleration of 5 meters per second squared, indicating her increasing position with time.
Blake has a velocity of negative 3 meters per second, indicating his decreasing position with time.
The concept of velocity as a vector is crucial in understanding the motion of objects in different directions.
The example of Angelica and Blake running towards each other demonstrates the application of vector concepts in physics.
Graphing the position versus time data allows for a visual representation of the runners' motion and the calculation of their velocities.
Understanding the intersection point on the graph can provide insights into the dynamics of the runners' motion.
Transcripts
Browse More Related Video
AP Physics Workbook 5.A Center of Mass

2021 AP Calculus AB Free Response #2 (First Administration)

AP Physics Workbook 1.B Position and Velocity

AP Physics Workbook 1.E Relative Velocity
Velocity and speed: Motion in One Dimension

AP Physics Workbook 1.H Relationship between Position,Velocity and Acceleration
5.0 / 5 (0 votes)
Thanks for rating: