Force-Time Graph
TLDRIn this AP Physics essentials video, Mr. Andersen explains the concept of force-time graphs, using the Saturn 5 rocket as a practical example. He details the three stages of the rocket's launch, each with different force applications and durations, and how these translate into changes in momentum. The video emphasizes the relationship between impulse (force times time) and change in momentum, and demonstrates how to calculate changes in velocity based on force-time graphs, highlighting the importance of considering mass changes in real-world scenarios.
Takeaways
- 🚀 The concept of a force-time graph is introduced, which illustrates the relationship between the force applied and the duration of its application.
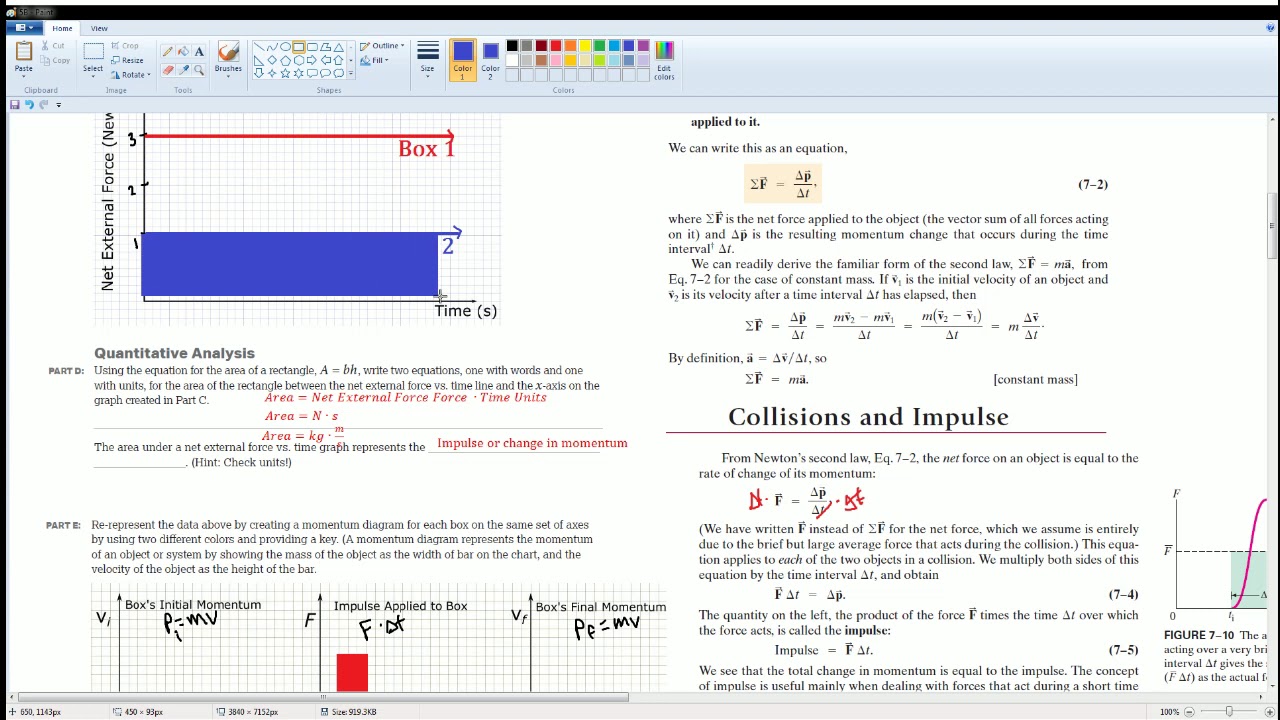
- 📈 The area under the force-time graph represents the impulse (measured in Joules), which is the product of force and time.
- 🌙 The example of the Saturn 5 rocket's three stages is used to demonstrate how varying forces and durations contribute to the overall change in momentum.
- 🔢 Impulse is equivalent to the change in momentum, which can be calculated as mass times the change in velocity.
- 🛰️ The first stage of the Saturn 5 rocket applies a force of 34 million Newtons for 165 seconds.
- 🔥 The second stage of the rocket has a lower force of 4 million Newtons but applies it for a longer duration of 360 seconds.
- 🌠 The third stage exerts 1 million Newtons of force and fires twice: once to reach escape velocity and again to align with the moon's trajectory.
- 📊 By analyzing the force-time graph, one can determine the change in momentum and subsequently calculate the change in velocity.
- 🎓 In AP Physics, it is assumed that the mass remains constant when calculating changes in velocity, although in reality, the mass of a rocket decreases as fuel is burned.
- 📝 The script provides a practical example of how to use the force-time graph to calculate the change in velocity of the Saturn 5 rocket, resulting in approximately 1900 meters per second.
- 📚 The video also discusses how to break down complex force-time graphs into simpler geometric shapes to calculate the total impulse.
Q & A
What is the main topic of the video?
-The main topic of the video is the force-time graph, which illustrates the relationship between the force applied and the duration of its application.
What is an example used in the video to explain the force-time graph?
-The video uses the example of the Saturn 5 rocket, a three-stage rocket that was used to send Apollo astronauts to the moon.
How is the force-time graph represented in the video?
-The force-time graph is represented as a graph where the force applied is plotted over time, and the area under the graph represents the impulse.
What is the significance of the area under the force-time graph?
-The area under the force-time graph is equal to the impulse, which is represented by the unit Joules (J) and is related to the change in momentum of an object.
How does the change in momentum relate to the impulse?
-The change in momentum is equivalent to the impulse, which is the product of the force applied and the time over which it is applied. Both are vector quantities and have the same direction.
What is the force applied during the first stage of the Saturn 5 rocket launch?
-During the first stage of the Saturn 5 rocket launch, the force applied is 34 million newtons.
How long is the force applied in the first stage of the Saturn 5 rocket launch?
-The force is applied for 165 seconds in the first stage of the Saturn 5 rocket launch.
What is the relationship between force, mass, and change in velocity according to the video?
-According to the video, the force applied (F) times time (t) is equal to mass (m) times the change in velocity (Δv), which can be represented by the equation F*t = m*Δv.
How does the mass of the rocket affect the change in velocity?
-As the rocket burns fuel, its mass decreases, which in turn increases the change in velocity for the same applied force and time, due to the inverse relationship between mass and velocity change in the momentum equation.
How can one calculate the change in momentum using a force-time graph?
-To calculate the change in momentum using a force-time graph, one must calculate the area under the curve, which represents the impulse. This impulse is then related to the change in momentum through the equation impulse = change in momentum.
What is the final change in velocity calculated for the Saturn 5 rocket example in the video?
-The final change in velocity calculated for the Saturn 5 rocket example is approximately 1900 meters per second, although NASA's value is higher at 2756 meters per second due to the decreasing mass of the rocket.
How can the principles discussed in the video be applied to solve problems in AP Physics?
-The principles discussed in the video can be applied to solve problems in AP Physics by understanding the relationship between force, time, impulse, and change in momentum. Students can use force-time graphs to calculate changes in momentum and velocity given the mass of an object, assuming the mass remains constant.
Outlines
🚀 Introduction to Force-Time Graphs and Impulse
This paragraph introduces the concept of force-time graphs, using the example of the Saturn 5 rocket's three stages to illustrate how force is applied over time. It explains that the area under the force-time graph represents impulse (measured in Newton-seconds), which is equivalent to the change in momentum (mass times change in velocity). The paragraph also covers how to calculate the change in velocity given a force-time graph and a constant mass, using the Saturn 5 rocket as a real-world example to demonstrate the calculation.
📈 Analyzing Force-Time Graphs for Momentum Change
The second paragraph delves into how to analyze force-time graphs to determine changes in momentum. It presents a hypothetical scenario where the change in force over time is given, and the task is to calculate the momentum change. The paragraph explains how to break down the graph into geometric shapes to calculate the area under the curve, representing the impulse. It then relates this impulse to the change in momentum and provides a method to calculate the change in velocity if the mass is known, offering an interactive element for the viewer to solve the problem.
Mindmap
Keywords
💡Force-time graph
💡Impulse
💡Momentum
💡Change in velocity
💡Saturn 5 rocket
💡Newton's second law
💡Mass
💡Three-stage rocket
💡Escape velocity
💡Trajectory
💡Data analysis
Highlights
The topic of the video is the force-time graph, which illustrates the relationship between the force applied and the duration of its application.
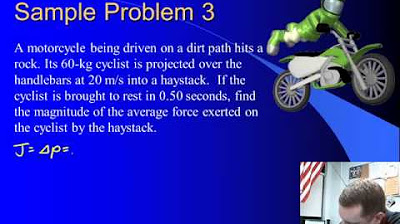
The Saturn 5 rocket, which carried Apollo astronauts to the moon, is used as an example to explain the force-time graph.
The Saturn 5 is a three-stage rocket with each stage having a different force and duration.
Stage 1 of the rocket applies a force of 34 million newtons for 165 seconds.
Stage 2 applies 4 million newtons of force over a period of 360 seconds.
Stage 3 applies 1 million newtons of force and fires twice, once for escape velocity and once for lunar trajectory.
The force-time graph for the first stage of the rocket is a representation of the impulse, measured in joules (J).
Impulse is equivalent to the change in momentum, which is mass times the change in velocity.
The area under the force-time graph represents the impulse, which can be used to calculate the change in momentum and velocity.
The second stage of the rocket has a longer duration, resulting in a greater change in momentum due to the extended application of force.
The change in linear momentum is equal to the mass times the change in velocity, which is also equal to the impulse (force times time).
Impulse and change in momentum are equivalent in units, with both measured in kilogram meters per second.
The force-time graph can be used to calculate the change in velocity of the Saturn 5 rocket, given its mass and the applied force over time.
The actual change in velocity calculated from the force-time graph (1900 m/s) is less than NASA's reported value (2756 m/s) due to the decreasing mass of the rocket as it burns fuel.
In AP Physics, questions will typically assume a constant mass for the purpose of calculating changes in velocity and momentum.
The video also covers how to calculate the change in momentum using a force-time graph by determining the area under the curve.
An example is provided to calculate the change in velocity given a force-time graph and the mass of the rocket.
The video aims to teach viewers how to calculate impulse (force times time), understand its equivalence to change in momentum, and perform data analysis on force-time graphs.
Transcripts


5.0 / 5 (0 votes)
Thanks for rating: