Jer Thorp: Numbers That Paint the Picture | Nat Geo Live
TLDRThe speaker discusses the pervasive nature of data in our lives, comparing our relationship with data to the complex system of air travel. They explore the concept of data triage and visualization, emphasizing the importance of understanding and ethically engaging with data. Through examples like Twitter-mapped world travel and social network analysis, they illustrate how data can be both simplified and revelatory, ultimately arguing for a multidisciplinary approach to data that includes artists and other creative voices.
Takeaways
- 📰 The speaker begins by noting the prevalence of the word 'data' in recent New York Times articles, highlighting the ongoing data conversation in society.
- ✈️ A metaphor of air travel is used to describe the complex and often incomprehensible nature of data systems and our experiences within them.
- 💭 The concept of 'data triage' is introduced, emphasizing the need to sort through and make sense of the overwhelming influx of information.
- 📊 The historical roots of data visualization are discussed, with examples from Florence Nightingale and John Snow illustrating its power to reveal insights.
- 🔍 Two reasons for data visualization are presented: to simplify complex information and to uncover previously unseen patterns or relationships.
- 🌐 The speaker shares personal projects that leverage social media data to create unique visualizations of global travel and daily routines.
- 🛠️ The importance of building exploratory tools for understanding and interacting with complex data sets is emphasized.
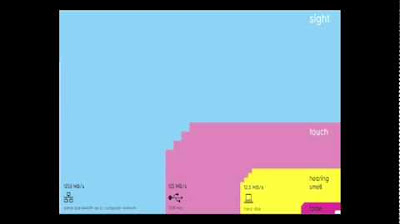
- 🌐 The architecture of conversation is visualized through the analysis of social media sharing patterns, revealing different structures for different types of content.
- 🎨 The process of visualization is described as not just a noun but a verb, involving an active exploration to generate new questions and insights.
- 🌟 The 'UA' strategy for data visualization is introduced, aiming to balance the intriguing 'U' (ooh) factor with the informative 'A' (ah) learning moment.
- 🏙️ The potential of data art and public installations is discussed, with examples of how data can be experienced collectively in public spaces.
- 🌍 The speaker argues against the metaphor of 'data as the new oil,' advocating for a deeper understanding of data's humanity and the ethical considerations it entails.
Q & A
How many articles mentioning the word 'data' were published in the New York Times in the last 24 hours according to the speaker?
-The speaker mentions that there were 42 articles published in the New York Times in the last 24 hours that mentioned the word 'data'.
What metaphor does the speaker use to describe the lived experience of data?
-The speaker uses the metaphor of the complex system of air travel to describe the lived experience of data, highlighting the vastness and intricacy of both systems.
What does the speaker suggest is the relationship between the data experience and the experience of being on an airplane?
-The speaker suggests that both experiences involve being part of a complex system that one can barely understand, and both involve a sense of loss of control.
What is the significance of the book 'Infinite Jest' by David Foster Wallace in the context of the speaker's talk?
-The book 'Infinite Jest' is significant because it is filled with footnotes and the author intended it to mimic the information flood and data triage that he believed would be a bigger part of our lives in the future, which the speaker relates to the current data conversation.
What are the two reasons the speaker gives for why we visualize data?
-The two reasons for visualizing data are to reduce complexity and make things simpler, and to reveal things, showing us things we have never seen before.
What was the purpose of the 'Just Landed' project the speaker worked on?
-The 'Just Landed' project aimed to collect tweets from people who had just landed in various locations and use that data to create a visual representation of world travel based on social media updates.
What tool did the speaker and Mark Hansen build at the New York Times?
-The speaker and Mark Hansen built a tool called Cascade, which was designed to analyze how content produced by the New York Times was being shared through social networks.
How does the speaker describe the different structures of Cascades for different types of stories?
-The speaker describes the structures of Cascades as being unique to the type of story, with some like Nicholas Kristoff's tending to be more spread out like shrubbery, and current event stories being more tall and quick to spread like Christmas trees.
What is the speaker's two-word strategy for data visualization?
-The speaker's two-word strategy for data visualization is 'UA', which stands for 'ooh and ah', emphasizing the importance of not only attracting attention (the 'ooh') but also providing a moment of learning or insight (the 'ah').
What is the main goal of the Office for Creative Research, the company the speaker started?
-The main goal of the Office for Creative Research is to explore new engagements with data and find innovative ways to bring data to the public in interesting and meaningful ways.
How does the speaker feel about the common metaphor of 'data is the new oil'?
-The speaker disagrees with the metaphor of 'data is the new oil', arguing that data is deeply human and should not be compared to oil, which has led to significant environmental and social problems.
Outlines
🌐 The Data Conversation and Lived Experience
The speaker begins by highlighting the prevalence of the word 'data' in recent New York Times articles, emphasizing the ongoing data conversation. They introduce the metaphor of air travel to describe the complex, yet often invisible, systems that govern our lives, drawing parallels to the data experience. The speaker expresses a desire to explore the lived experience of data and the sense of control we lose when engaging with such systems. They reference David Foster Wallace's use of footnotes to mimic the information flood, predating the current data triage, and discuss the importance of data visualization as a tool for both simplification and revelation.
🌟 Exploring Data Through Visualization
The speaker delves into the concept of data visualization, tracing its history back to the 19th and early 20th centuries with examples like Florence Nightingale's and John Snow's graphics. They argue that visualization serves two purposes: simplifying complex information and revealing new insights. The speaker shares their own work, including a project that visualizes global travel patterns from Twitter data and another that maps the structure of Twitter conversations. They emphasize the importance of the 'Aha!' moment in data visualization, where viewers not only find something intriguing (the 'U') but also gain a deeper understanding (the 'Aha!').
🌍 Public Engagement with Data
The speaker discusses the need to bring data into public spaces and shared experiences, moving beyond digital screens. They describe a project at the University of Texas that displays news-related entities in a large-scale, public installation, which has led to community engagement with the news. The speaker challenges the notion that data is the 'new oil,' arguing that data is deeply human and should be shared for the betterment of society. They advocate for a multidisciplinary approach to data, including input from artists and other creative fields, to drive meaningful change and ethical considerations in our relationship with data.
Mindmap
Keywords
💡Data
💡Lived Experience
💡Data Visualization
💡Triage
💡Cascade
💡Conversation Architectures
💡Question Farming
💡Ooh and Ah
💡Public Space
💡Data Ethics
💡Data Art
Highlights
The speaker's curiosity about the frequency of the word 'data' in the New York Times, finding 42 articles in the last 24 hours and nearly 2,000 this year.
The metaphor of air travel to describe the complexity and lived experience of data, emphasizing the staggering number of people in the air and the sense of being part of a complicated system.
The concept of data triage, introduced by the American novelist David Foster Wallace, to mimic the information flood expected in the future.
The historical context of data visualization, dating back to the late 1800s and early 1900s, with examples like Florence Nightingale's graphic on soldier casualties.
The dual purpose of data visualization: to simplify complex information and to reveal new insights that were previously unseen.
The project 'Just Landed', which aggregates tweets about people landing in various locations to visualize global travel patterns.
The 'Good Morning' project, mapping the times people wake up and say 'good morning' on Twitter, showing different patterns across the world.
The speaker's two-and-a-half-year residency at the New York Times, working with statistician Mark Hansen to build a tool called Cascade for analyzing content sharing through social networks.
The discovery of different conversation structures in Cascade for different types of stories, like the 'shrubbery' structure for Nicholas Kristoff's stories and the 'Christmas tree' structure for current event stories.
The importance of the process of visualization, emphasizing it as an active exploration rather than just a static representation.
The Kepler project paper and the speaker's personal visualization of the data, offering a new perspective on the discovered planets and their characteristics.
The two-word strategy 'UA' (Ooh and Ah) for data visualization, aiming to first attract attention and then provide a meaningful learning moment.
The gestural interface developed for the Kepler project visualization, created in collaboration with a team in Los Angeles and the designer behind Minority Report.
The establishment of the Office for Creative Research, a multi-disciplinary group focused on new engagements with data and public presentations.
The project 'The Way It Is', a permanent installation at the University of Texas that visualizes news feeds from Austin, offering a collective public experience of data.
The exploration of data ethics and the impact on human lives, questioning the metaphor of 'data is the new oil' and advocating for a more thoughtful approach to data usage.
The call for a multidisciplinary dialogue involving not only scientists and industry professionals but also poets, actors, and artists to drive change and conversation in the field of data.
Transcripts
Browse More Related Video
The beauty of data visualization | David McCandless

Don't Be Fooled By Bad Statistics

Adding ID Columns to Node and Edge Tables Using Excel Lookup()

Data Analysis for BEGINNERS in Excel in 2024 | No Python Required
Marco Bonzanini - Lies, damned lies, and statistics
Getting Started with Network Data Using Gephi
5.0 / 5 (0 votes)
Thanks for rating: