Permutation Hypothesis Testing with Example | Statistics Tutorial # 37 | MarinStatsLectures
TLDRThis video script delves into permutation approaches for hypothesis testing, highlighting their utility in scenarios with small sample sizes or when assumptions for traditional tests are not met. It introduces the fundamental elements of hypothesis testing, such as null and alternative hypotheses, test statistics, and p-values. The script uses a simplified example of chick weights on different diets to illustrate comparing means and medians, and emphasizes the flexibility of permutation tests for more specific hypotheses. The process of creating permutation datasets and estimating the p-value is also explained, showcasing the method's reliance on simulating data permutations rather than relying on theoretical distributions.
Takeaways
- 📚 The video discusses permutation approaches to hypothesis testing, explaining when and why one might prefer this method.
- 🔍 The script uses a simplified example of the weights of chicks on two different diets to illustrate permutation testing.
- 🌟 The basic elements of a hypothesis test are consistent across different approaches, including specifying null and alternative hypotheses, choosing a test statistic, determining the test statistic's distribution, and calculating the p-value.
- 📈 The video compares different test statistics, such as the absolute difference in means and medians, for the purpose of the hypothesis test.
- 🤔 The script suggests using permutation tests for small sample sizes, when assumptions for large sample approaches are not met, or when testing more specific hypotheses.
- 🔄 Permutation testing involves considering all possible orderings of the data under the null hypothesis, where the labels of the groups are irrelevant.
- 🔢 The script explains that calculating all possible permutations is impractical, so a simulation with a sample of permutations is used instead.
- 📊 The process of creating permutation datasets and calculating test statistics for each permutation is demonstrated to build the distribution of the test statistic.
- 🎯 The p-value in permutation testing is determined by the proportion of permutation test statistics that are more extreme than the observed test statistic.
- ⚠️ A limitation of permutation testing highlighted in the script is that it does not allow for the construction of confidence intervals, only hypothesis testing.
- 💻 The video concludes with an intention to demonstrate the permutation test on the full dataset using statistical software R.
Q & A
What is the main topic of the video?
-The main topic of the video is discussing permutation approaches to hypothesis testing, particularly in the context of comparing the weights of chicks on different diets.
What are the basic elements of a hypothesis test according to the video?
-The basic elements of a hypothesis test are specifying a null and an alternative hypothesis, choosing a test statistic, determining the distribution of the test statistic under the null hypothesis, and converting the test statistic into a p-value.
Why might one prefer to use a permutation approach for hypothesis testing?
-A permutation approach might be preferred when the sample size is small, the assumptions for large sample approaches are not met, or when testing something more specific than comparing means or medians, such as the 10th percentile of the distribution.
What are the two test statistics discussed in the video for comparing the weight gain of chicks on two different diets?
-The two test statistics discussed are the absolute difference in means between the two diets and the absolute difference in medians between the two diets.
What is the null hypothesis in the context of the video's example?
-The null hypothesis in the context of the video's example is that the weight gain is the same under both diets.
How does the permutation approach handle the assumption of the null hypothesis being true?
-The permutation approach assumes that the observations are equally likely to belong to either feed type, meaning that the weights and the feed types are independent, and the labels are irrelevant.
What is the process of creating a permutation dataset in the permutation approach?
-The process involves randomly selecting observations without replacement to create a new ordering, which represents a unique permutation dataset. This is done repeatedly to generate multiple permutation datasets.
Why is it impractical to consider all possible permutations for a large dataset?
-It is impractical because the number of possible permutations grows factorially with the number of observations, making it computationally infeasible to calculate for large datasets.
How can the distribution of test statistics be estimated using permutations?
-By repeatedly shuffling the observations to create multiple permutation datasets, calculating the test statistic for each, and then analyzing the distribution of these test statistics to estimate the sampling distribution under the null hypothesis.
What is the concept of a p-value in the context of permutation testing?
-The p-value in permutation testing is the proportion of permutation test statistics that are greater than or equal to the observed test statistic, indicating the probability of observing the sample results or something more extreme under the null hypothesis.
What is a limitation of the permutation approach mentioned in the video?
-A limitation of the permutation approach is that it does not allow for the construction of confidence intervals; it is only used for hypothesis testing.
How does the video plan to demonstrate the permutation test using the full dataset?
-The video plans to demonstrate the permutation test using the full dataset by implementing the concept in the statistical software R, for both test statistic one and test statistic number two.
Outlines
📊 Introduction to Permutation Approaches in Hypothesis Testing
This paragraph introduces the topic of permutation approaches within the context of hypothesis testing. It sets the stage for a discussion on why and when these approaches might be preferred. The video will use a simplified example involving the weights of chicks on different diets to illustrate concepts. The presenter emphasizes the importance of specifying null and alternative hypotheses, choosing a test statistic, determining the distribution of the test statistic under the null hypothesis, and converting the test statistic into a p-value. The focus is on comparing two diets to see if there is a significant difference in weight gain after six weeks, using a dataset of nine observations.
🔍 Choosing Test Statistics for Hypothesis Testing
The second paragraph delves into the selection of test statistics for hypothesis testing. It discusses the comparison of two different test statistics: the absolute difference in means and the absolute difference in medians between two groups. The presenter uses the example of casein and meat meal diets to demonstrate how these statistics are calculated from observed data. The paragraph also explains the expectation that under the null hypothesis, these test statistics should be close to zero, indicating no difference between the groups. The goal is to determine the probability of obtaining the observed test statistics or something more extreme if the null hypothesis is true, which will be explored through a permutation testing approach.
🔄 The Concept of Permutation Testing
This paragraph explains the permutation testing approach, starting with the assumption that under the null hypothesis, the observations are equally likely to belong to either group, suggesting that the labels (casein or meat meal) are irrelevant. The presenter outlines the process of creating permutation datasets by randomly shuffling the observations and calculating the test statistics for each permutation. The idea is to explore all possible orderings of the data to build the distribution of test statistics under the null hypothesis. The paragraph also touches on the impracticality of calculating all permutations for large datasets and suggests using a simulation approach instead, with a recommendation of at least 10,000 permutations for a robust analysis.
📈 Estimating P-Values and Limitations of Permutation Testing
The final paragraph discusses the process of estimating p-values through permutation testing. It describes how to create a sampling distribution of test statistics by running multiple permutations and then calculating the p-value as the proportion of permutation test statistics that are greater than or equal to the observed test statistic. The paragraph also highlights a limitation of permutation testing: the inability to construct confidence intervals, as it is a method designed for hypothesis testing rather than estimation. The presenter concludes by mentioning the intention to apply these concepts to a full dataset using the statistical software R, and encourages viewers to subscribe for more educational content.
Mindmap
Keywords
💡Permutation Approaches
💡Hypothesis Testing
💡Null Hypothesis
💡Alternative Hypothesis
💡Test Statistic
💡P-Value
💡Resampling
💡Wilcoxon Rank-Sum Test
💡Bootstrap Approach
💡Confidence Interval
💡R (Statistical Software)
Highlights
Introduction to permutation approaches in hypothesis testing.
Discussion on when or why to prefer permutation testing over other methods.
Use of a simplified dataset with nine observations to illustrate concepts.
Basic elements of a hypothesis test, including null and alternative hypothesis specification.
Importance of working under the assumption that the null hypothesis is true.
Explanation of choosing a test statistic to compare observed data to expected outcomes under the null hypothesis.
Determining the distribution of the test statistic under the null hypothesis.
Conversion of the test statistic into a p-value to measure evidence against the null hypothesis.
Question posed: Do two diets differ in terms of weight gain of chicks?
Different ways to define 'differ' in a hypothesis test, such as comparing means, medians, or percentiles.
Comparison of parametric, nonparametric, and permutation approaches for hypothesis testing.
Reasons for choosing a permutation test, including small sample size and specific hypothesis testing needs.
Explanation of permutation testing when assumptions for large sample tests are not met.
Demonstration of calculating test statistics for mean and median differences under the null hypothesis.
Concept of building the distribution of test statistics through permutation.
Description of the permutation process and its implications for hypothesis testing.
Limitation of permutation testing in building confidence intervals.
Preview of implementing permutation tests using statistical software R with the full dataset.
Transcripts
Browse More Related Video
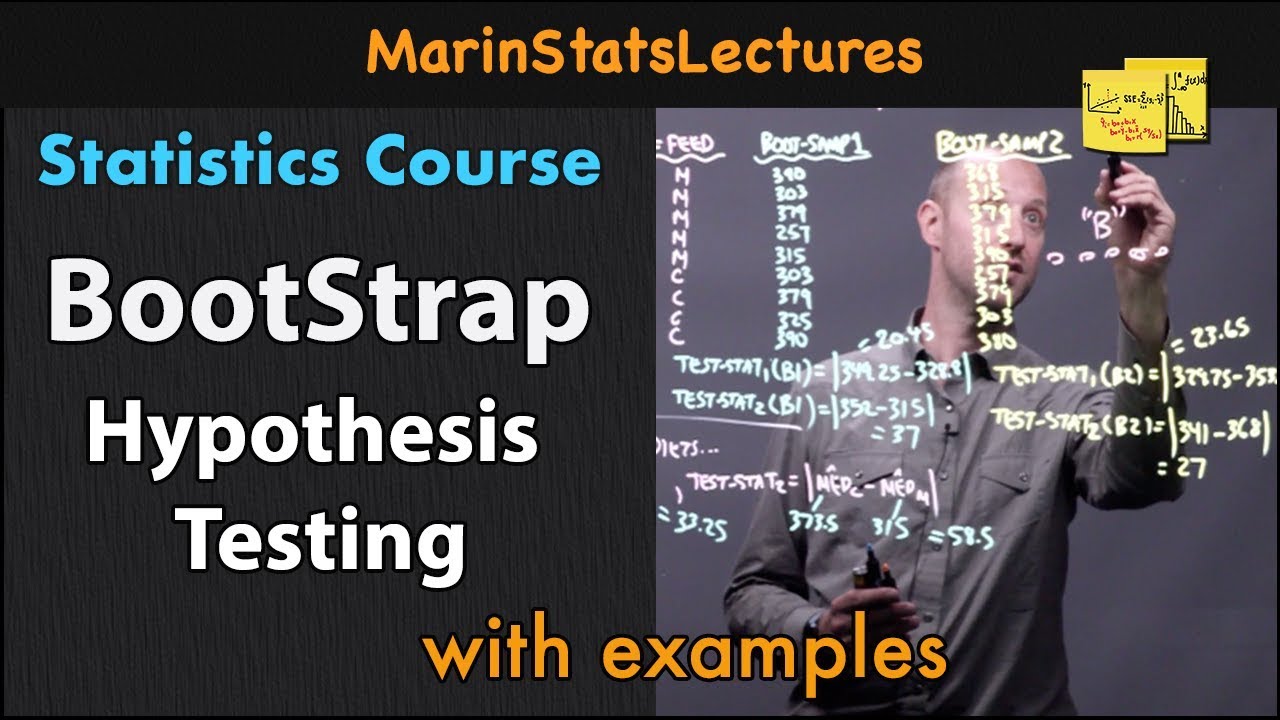
Bootstrap Hypothesis Testing in Statistics with Example |Statistics Tutorial #35 |MarinStatsLectures
Permutation Hypothesis Test in R with Examples | R Tutorial 4.6 | MarinStatsLectures
Hypothesis testing: step-by-step, p-value, t-test for difference of two means - Statistics Help
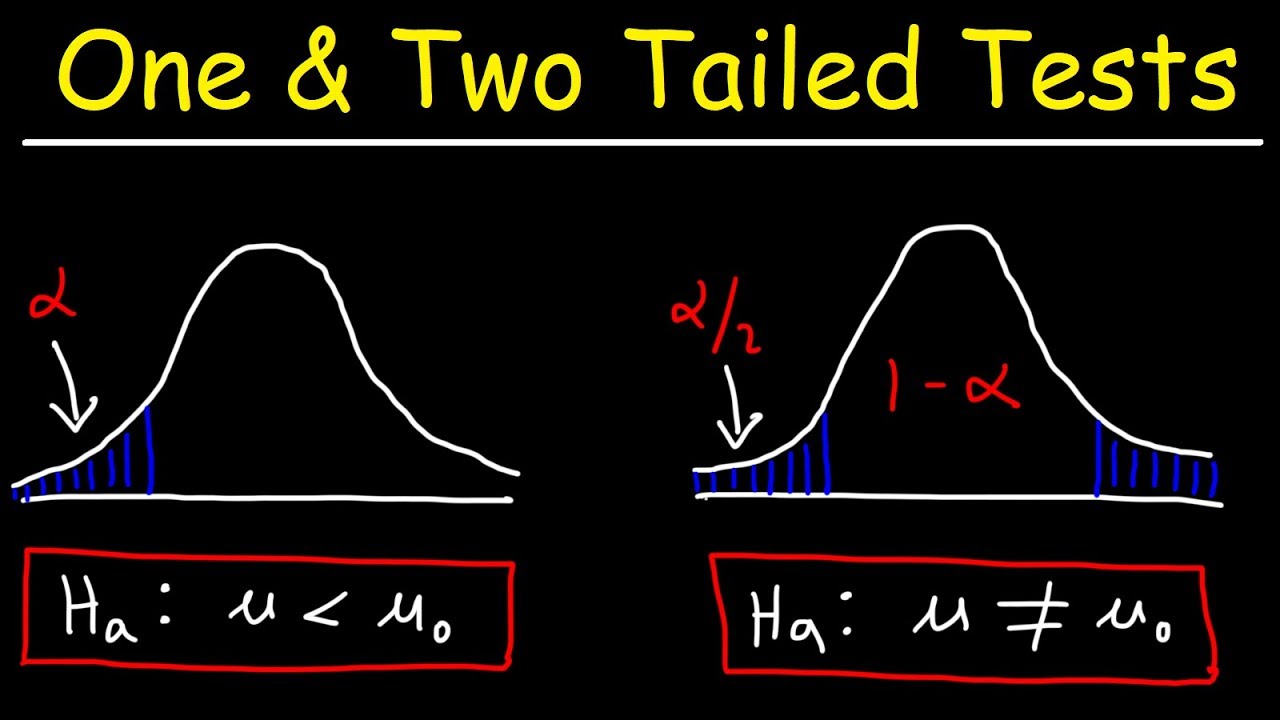
One Tailed and Two Tailed Tests, Critical Values, & Significance Level - Inferential Statistics
Bootstrap Hypothesis Testing in R with Example | R Video Tutorial 4.4 | MarinStatsLecutres

One-tailed and two-tailed tests | Inferential statistics | Probability and Statistics | Khan Academy
5.0 / 5 (0 votes)
Thanks for rating: