ANOVA, ANOVA Multiple Comparisons & Kruskal Wallis in R | R Tutorial 4.9 | MarinStatsLectures|
TLDRIn this video, Mike Marin introduces one-way ANOVA and Kruskal-Wallis tests using R software. He guides through comparing weight loss across four diets, utilizing box plots and 'aov' for ANOVA, resulting in a significant p-value, indicating unequal means. The 'TukeyHSD' function is applied for multiple comparisons, with a visual display aiding in identifying differing means. The video concludes with a brief on Kruskal-Wallis, a nonparametric alternative, and a teaser for the next video on Pearson's chi-square test.
Takeaways
- 📊 The video is about conducting one-way ANOVA and Kruskal-Wallis one-way analysis using R Statistical Software.
- 🔍 One-way ANOVA is a parametric method for comparing the means of two or more independent populations.
- 📈 The example data set compares Weight Loss for four different Diets, aiming to explore the relationship between Weight Loss and Diet type.
- 📝 The 'aov' function in R is used to conduct the analysis of variance.
- 📚 To get help in R, you can use the 'help' command or a question mark before the command/function name.
- 📉 Before testing, a box plot is useful to examine the data distribution separated by Diet type.
- ❓ The null hypothesis in ANOVA is that the Mean Weight Loss is the same for all Diets.
- 📑 The 'summary' function in R provides a more informative summary of the ANOVA results.
- 🔢 The results include Sum of Squares, Mean Squares, f-statistic, and p-value.
- 🔑 The 'attributes' command in R can be used to view what is stored in an object, and the '$' sign can extract specific attributes.
- 🚫 The null hypothesis is rejected if the evidence suggests that not all means are equal.
- 🔄 The 'TukeyHSD' function in R is used for multiple comparisons to determine which means or diets differ from others.
- 📊 A plot can visually display the results of 'TukeyHSD', helping to identify differences between means or diets.
- 📝 The 'kruskal.test' function in R performs the Kruskal-Wallis test, a nonparametric alternative to one-way ANOVA.
- 🔄 The Kruskal-Wallis test also rejects the null, indicating differences between the weight loss of different diet types.
- 🔍 The next video will discuss Pearson's chi-square test of independence.
Q & A
What is the main topic of the video by Mike Marin?
-The video by Mike Marin is about conducting one-way analysis of variance (ANOVA) and Kruskal-Wallis one-way analysis of variance using R Statistical Software.
What statistical method is appropriate for comparing the means of two or more independent populations according to the video?
-One-way analysis of variance (ANOVA) is the parametric method appropriate for comparing the means of two or more independent populations.
What dataset does Mike Marin use in the video to demonstrate ANOVA?
-Mike Marin uses a dataset that compares Weight Loss for four different Diets to demonstrate ANOVA in the video.
How can one access help for a specific command or function in R, as mentioned in the video?
-To access help for a specific command or function in R, one can type 'help' followed by the command name in brackets, or simply use a question mark (?) in front of the command/function name.
What is the null hypothesis being tested in the one-way ANOVA for the Weight Loss data?
-The null hypothesis being tested is that the Mean Weight Loss is the same for all Diets.
What command in R is used to conduct the analysis of variance as per the video?
-The 'aov' command in R is used to conduct the analysis of variance.
What function can be used in R to obtain a more informative summary of the ANOVA results?
-The 'summary' function can be used in R to obtain a more informative summary of the ANOVA results.
What does the 'attributes' command in R allow us to do with the ANOVA1 object?
-The 'attributes' command in R allows us to know all that is stored in the ANOVA1 object.
How can one extract certain attributes from the ANOVA1 object in R?
-One can extract certain attributes from the ANOVA1 object in R using the dollar sign ($) to pull out specific components like coefficients.
What does the video suggest using for multiple comparisons to determine which means or diets may differ from others after ANOVA?
-The video suggests using the 'TukeyHSD' command/function for multiple comparisons to determine which means or diets may differ from others.
What nonparametric test is the Kruskal-Wallis one-way analysis of variance equivalent to?
-The Kruskal-Wallis one-way analysis of variance is a nonparametric equivalent to the one-way ANOVA.
How can one visualize the results of Tukey's Honest Significant Difference test in R?
-One can visualize the results of Tukey's Honest Significant Difference test in R by using a 'plot' command around the 'TukeyHSD' command.
What adjustment can be made to the plot in R to better display the labels on the y-axis?
-The 'las' argument can be set equal to 1 to rotate the labels on the y-axis for better display.
Outlines
📊 Introduction to One-Way ANOVA and Kruskal-Wallis Test
Mike Marin introduces the video by explaining that it will cover the one-way analysis of variance (ANOVA) and the Kruskal-Wallis test using R Statistical Software. The video will focus on comparing weight loss across four different diets. The data has been imported into R and is ready for analysis. The main goal is to examine the relationship between weight loss and diet type, starting with a box plot to visualize the data. The null hypothesis for the ANOVA is that the mean weight loss is the same for all diets.
🔍 Conducting ANOVA in R with 'aov' Command
The script details the process of conducting a one-way ANOVA in R using the 'aov' command. It suggests saving the output in an object named 'ANOVA1' for later reference. To enhance understanding, the 'summary' command is used to provide a more informative summary of the ANOVA results, including sum of squares, mean squares, f-statistic, and p-value. The script also mentions using the 'attributes' command to explore what is stored in the 'ANOVA1' object and extracting coefficients for further analysis.
📉 Interpreting ANOVA Results and Using 'TukeyHSD' for Multiple Comparisons
After conducting the ANOVA, the script explains how to interpret the results, which in this case indicate a rejection of the null hypothesis, suggesting that not all means are equal. To explore which diets differ from each other, the 'TukeyHSD' function is introduced for conducting all possible pair-wise comparisons. This function provides 95% confidence intervals for the differences in means and adjusted p-values. The script also touches on visualizing these results with a plot, including tips for customizing the plot, such as rotating labels with the 'las' argument.
📈 Nonparametric Alternative: Kruskal-Wallis Test
The script then shifts focus to the Kruskal-Wallis test, a nonparametric alternative to one-way ANOVA, which is conducted using the 'kruskal.test' command in R. The test is used to compare weight loss across different diet types without assuming normality of the data. The script humorously notes the absence of 'Wallace' in the command name and confirms that the null hypothesis is rejected, indicating significant differences between the diet types.
🔚 Conclusion and Upcoming Content Preview
In conclusion, the video script wraps up by thanking viewers for watching and encouraging them to subscribe to 'marinstatslectures' for more content. It also previews the next topic in the series, which will be Pearson's chi-square test of independence.
Mindmap
Keywords
💡One-way ANOVA
💡Parametric method
💡R Statistical Software
💡Box plot
💡Null hypothesis
💡aov command
💡Sum of Squares
💡Mean Squares
💡f-statistic
💡p-value
💡TukeyHSD
💡Kruskal-Wallis test
💡Confidence intervals
💡Adjusted p-value
Highlights
Introduction to conducting one-way analysis of variance (ANOVA) and Kruskal-Wallis one-way analysis using R Statistical Software.
One-way analysis of variance (ANOVA) is a parametric method for comparing the means of two or more independent populations.
Data set used compares Weight Loss for four different Diets.
Using the 'aov' command in R to conduct ANOVA.
Importance of examining a box plot of the data before conducting the test.
Null hypothesis for ANOVA: Mean Weight Loss is the same for all Diets.
Saving the output of the test in an object called ANOVA1.
Using the 'summary' command in R for an informative summary of ANOVA results.
Returned results include Sum of Squares, Mean Squares, F-statistic (6.118), and p-value (0.00113).
Using the 'attributes' command to explore what is stored in the ANOVA1 object.
Extracting certain attributes from objects using the dollar sign ($) in R.
Rejecting the null hypothesis based on ANOVA results and concluding that not all means are equal.
Using 'TukeyHSD' command for multiple comparisons to determine which Means or Diets differ.
Returned 95% confidence intervals and adjusted p-values for differences in Means of all pairs.
Adding 'plot' command around 'TukeyHSD' for a visual display of results.
Editing the plot using arguments like 'las' to rotate labels on the y-axis.
Introduction to Kruskal-Wallis one-way analysis of variance using ranks, a nonparametric equivalent to ANOVA.
Conducting the Kruskal-Wallis test in R using the 'kruskal.test' command.
Conclusion that null hypothesis is rejected in the Kruskal-Wallis test as well.
Mention of the next video in the series covering Pearson's chi-square test of independence.
Encouragement to subscribe to the MarinStatsLectures channel.
Transcripts
Browse More Related Video

Understanding Analysis of Variance (ANOVA) including Excel - Statistics Help
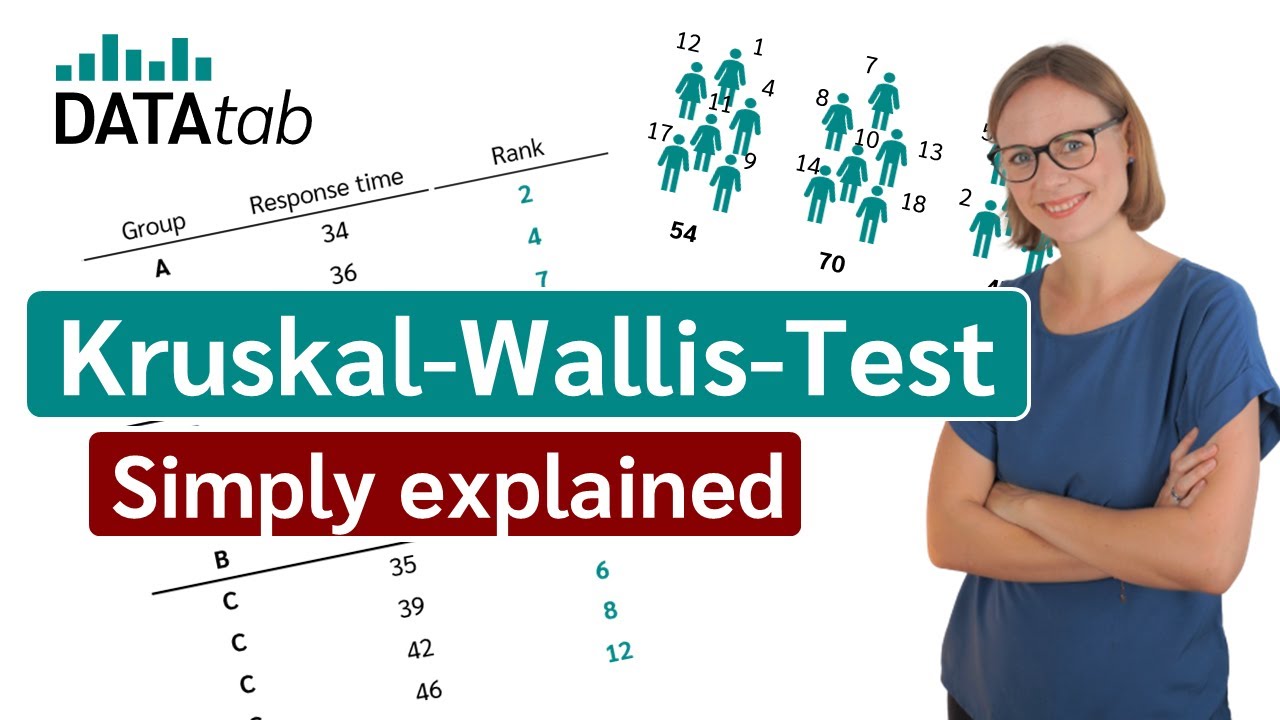
Kruskal-Wallis-Test (Simply explained)
One Way ANOVA (Analysis of Variance): Introduction | Statistics Tutorial #25 | MarinStatsLectures
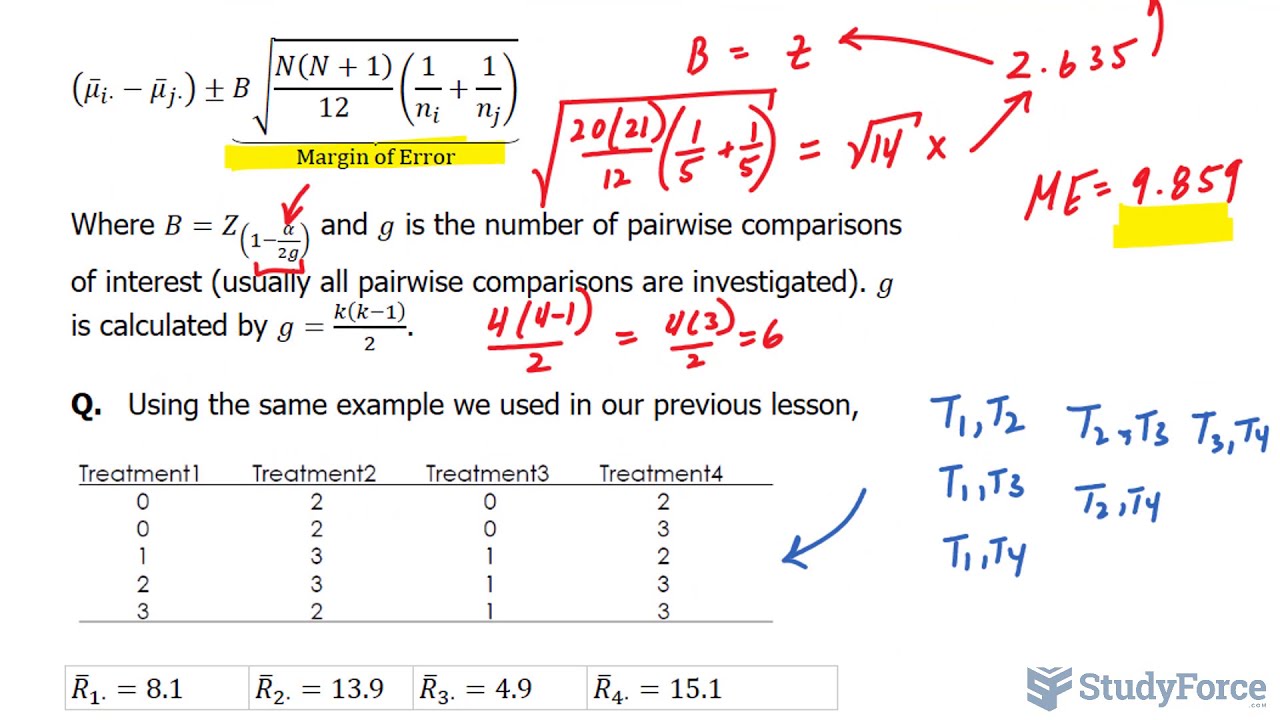
Bonferroni's Method for Pairwise Multiple Comparisons

ANOVA Part III: F Statistic and P Value | Statistics Tutorial #27 | MarinStatsLectures
Bootstrap Hypothesis Testing in R with Example | R Video Tutorial 4.4 | MarinStatsLecutres
5.0 / 5 (0 votes)
Thanks for rating: