Average x-Coordinate in a Region | MIT 18.01SC Single Variable Calculus, Fall 2010
TLDRIn this recitation, the professor guides students through two calculus problems involving a region R bounded by y=x and y=x^3 in the first quadrant. The first problem calculates the average x-coordinate of points in R using weighted integration. The second problem determines the probability that a randomly chosen point's x-coordinate exceeds 1/2, by comparing the area of the region to the right of x=1/2 with the total area of R. The solutions involve integral computations, revealing that the average x-coordinate is slightly above 1/2 and the probability of a point being on the right side of the line y=1/2 is also slightly more than 1/2.
Takeaways
- 📚 The session is a recitation focused on exercises involving computing average values and probabilities using integration.
- 📉 The region R is defined by the curves y = x and y = x^3, bounded above and below respectively, located in the first quadrant.
- 🧩 The first problem asks for the average x-coordinate of all points in region R, which is found by computing a weighted average.
- 📊 The weight function for the average x-coordinate is determined by the area above each x-value, which is the difference between the two curves.
- ⚖️ The average value of x is calculated by dividing the integral of x times the weight function by the total area under the curves from 0 to 1.
- 🔢 The integral for the total area (denominator) is found to be 1/4, by integrating (x - x^3) from 0 to 1.
- 📈 The integral for the weighted average (numerator) is calculated by integrating x^2 - x^4 from 0 to 1, resulting in 2/15.
- 📝 The average x-coordinate is the ratio of the two integrals, which simplifies to 8/15, indicating a slight shift to the right of 1/2.
- 🎯 The second problem is about finding the probability that a randomly chosen point in R has an x-coordinate greater than 1/2.
- 📐 The probability is determined by the area of the region to the right of x = 1/2 (good area) divided by the total area of R.
- 📉 The good area is found by integrating from 1/2 to 1, and the result is 9/64.
- 🎲 The probability of the x-coordinate being greater than 1/2 is the good area (9/64) divided by the total area (1/4), which equals 9/16.
Q & A
What is the main topic of the recitation session described in the transcript?
-The main topic of the recitation session is computing average values and probabilities using integration over a specific region R bounded by two curves, y = x and y = x^3.
What are the two specific problems discussed in the session?
-The two problems discussed are: 1) Finding the average x-coordinate of all points in region R, and 2) Calculating the probability that a randomly chosen point in R has an x-coordinate larger than 1/2.
What is the significance of the region R in the context of the problems?
-Region R is significant because it defines the area over which the average value of the x-coordinate is to be computed and within which the probability of a point having an x-coordinate greater than 1/2 is to be determined.
How is the average value of the x-coordinate of points in R computed?
-The average value is computed by taking a weighted average, where the weight function is the height of the region at a given x-coordinate, and the function being averaged is x. The result is the ratio of the integral of x times the weight function over the integral of the weight function alone.
What is the weight function used in the computation of the average x-coordinate?
-The weight function is the height of the region at a given x-coordinate, which is represented by the difference between the two curves, y = x and y = x^3, or simply x - x^3.
What is the result of the first problem, the average x-coordinate of points in R?
-The average x-coordinate of points in R is calculated to be 8/15, which is slightly larger than 1/2.
How is the probability that a randomly chosen point in R has an x-coordinate larger than 1/2 determined?
-The probability is determined by finding the area of the region to the right of the line x = 1/2 (the 'good area') and dividing it by the total area of region R.
What is the total area of region R as computed in the transcript?
-The total area of region R is found to be 1/4, which is the denominator of the average value computation.
What is the result of the second problem, the probability that a randomly chosen point has an x-coordinate larger than 1/2?
-The probability is calculated to be 9/16, indicating that there is a slightly higher chance of a random point being to the right of the line x = 1/2 than to the left.
What does the transcript suggest about the symmetry of region R?
-The transcript suggests that although the region R might appear symmetrical, it is actually slightly shifted to the right, as indicated by the average x-coordinate being 8/15 and the probability of a point being to the right of x = 1/2 being 9/16.
What is the significance of the integrals computed in the transcript?
-The integrals are significant as they provide the necessary values to calculate both the average x-coordinate and the probability of a point having an x-coordinate greater than 1/2 within region R.
Outlines
📚 Introduction to Average Values and Probabilities
The professor begins a recitation session by introducing the topic of computing average values and probabilities using integration. The region of interest, denoted by R, is bounded by the curves y=x and y=x^3 in the first quadrant. The first exercise is to find the average x-coordinate of all points in R, while the second is to determine the probability of randomly selecting a point in R with an x-coordinate greater than 1/2. The professor suggests pausing the video to attempt these problems before continuing with the solutions.
🧮 Calculating the Average X-coordinate of Points in R
The professor explains the method to compute the average value of a function over a region, emphasizing the importance of considering the weight function, which represents the area above a given x-coordinate. The weight function is derived from the difference in the curves y=x and y=x^3. The average x-coordinate is calculated by integrating the product of x and the weight function over the interval [0, 1] and then dividing by the total area of the region R. The integrals are computed, yielding the average x-coordinate as 8/15, which is slightly greater than 1/2, indicating a slight rightward shift of the average point in R.
🎯 Determining the Probability of a Point's X-coordinate Being Greater Than 1/2
The second part of the lecture focuses on calculating the probability that a randomly chosen point in R has an x-coordinate greater than 1/2. The probability is determined by comparing the area of the region to the right of the line x=1/2 with the total area of R. The 'good area' is calculated by integrating from 1/2 to 1, and the resulting area is divided by the total area of R, which was previously found to be 1/4. The computed probability is 9/16, suggesting that it is more likely for a point to be found to the right of the line x=1/2 than to the left.
📝 Summary of the Problems Concerning Region R
The final part of the video script provides a summary of the problems addressed in the session. The first problem involved calculating the average x-coordinate of points in region R, which was found to be 8/15. The second problem was to find the probability of a point having an x-coordinate greater than 1/2, which was determined to be 9/16. The summary highlights the methods used and the results obtained, reinforcing the understanding of the concepts of average values and probabilities in the context of integration.
Mindmap
Keywords
💡Recitation
💡Integration
💡Average Value
💡Region R
💡Weighted Average
💡Probability
💡X-coordinate
💡Total Area
💡Good Area
💡Random Point
💡Conditional Probability
Highlights
Introduction to the problem of computing average values and probabilities using integration.
Definition of the region R bounded by y=x and y=x^3 in the first quadrant.
Exploration of the average x-coordinate of points in R through integration.
Explanation of the concept of a weighted average in the context of the problem.
Illustration of how the weight function represents the area above a given x-coordinate.
Calculation of the average value of x in R using the integral of x * (x - x^3) dx.
Derivation of the total weight of the region as the integral from 0 to 1 of (x - x^3) dx.
Simplification of the integral to find the area under the curves y=x and y=x^3.
Result of the total area calculation, which is 1/4.
Calculation of the numerator integral for the average x-coordinate, resulting in 2/15.
Final computation of the average x-coordinate as 8/15, slightly greater than 1/2.
Introduction to the second problem: finding the probability that a random point's x-coordinate is greater than 1/2.
Relating the probability to the area of the region to the right of the line x=1/2.
Integration from 1/2 to 1 to find the 'good area' for the probability calculation.
Solving the integral to find the area between the curves to the right of x=1/2.
Result of the 'good area' calculation, which is 9/64.
Final probability calculation, showing a likelihood of 9/16 for the x-coordinate to be greater than 1/2.
Summary of the two problems solved concerning the region R, emphasizing the average value and probability calculations.
Transcripts
Browse More Related Video
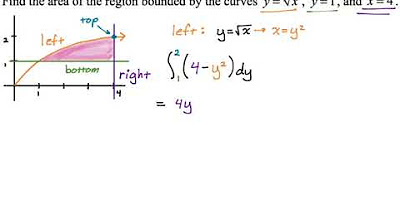
Area Between Curves: Integrating with Respect to y (Example 3)
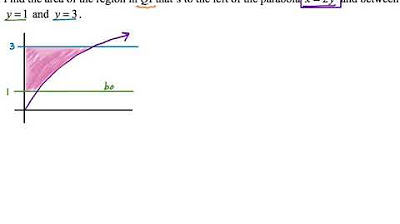
Area Between Curves: Integrating with Respect to y (Example 1)

Area Between y=x^3 and y=3x-2 | MIT 18.01SC Single Variable Calculus, Fall 2010
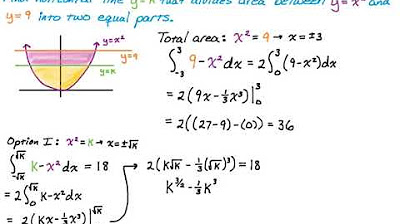
Finding a Horizontal Line (y=k) to Divide a Region into Two Equal Parts Using Calculus

Volume of a Paraboloid via Disks | MIT 18.01SC Single Variable Calculus, Fall 2010

2012 AP Calculus AB Free Response #2
5.0 / 5 (0 votes)
Thanks for rating: