Math 8 4 10 Homework Help Morgan
TLDRThis video script from Math 8 Unit 4 Lesson 10 explores the interpretation of points in a coordinate plane, focusing on identifying which graph doesn't belong among a set of four. It then delves into a 'pocket full of change' problem, challenging viewers to determine the number of quarters and dimes based on their total value and count. The lesson continues with a practical scenario involving Claire and Andre making signs, teaching how to represent and analyze linear relationships on a graph. The script concludes with exercises on equations and earning rates, emphasizing the importance of understanding where equations intersect to find solutions.
Takeaways
- 📚 The lesson focuses on interpreting points in a coordinate plane and determining which graph does not belong among a set of four, based on their characteristics and intersections.
- 🧩 The video uses a 'pocket full of change' scenario to explore combinations of quarters and dimes that make up two dollars, and how to represent these combinations in a table and on a graph.
- 🔢 It explains how to complete a table for different combinations of coins that equal a specific total value, and how to use the table to solve for the exact number of each type of coin.
- 📈 The script discusses the use of graphs to represent discrete points, such as the number of quarters and dimes, and how these points can be used to solve for the total value and count of coins.
- 🏆 The video presents a problem involving two characters, Claire and Andre, who are making signs, and it uses a graph to show their progress over time and determine when they have made a certain number of signs.
- ⏱️ It explains how to determine the truth of statements about the number of signs made at specific times by analyzing their positions on a graph.
- 🔑 The lesson introduces the concept that the coordinates of a point on both lines of a graph make both equations true, which is key to solving problems involving two variables.
- 📝 The script walks through a process of solving equations to find a common solution, such as the number of hours worked and the amount earned, without fractions for easier understanding.
- 📉 The video provides an example of how to set up and solve equations for two different earning scenarios to find out when the earnings are the same.
- 📊 It discusses the use of tables, graphs, and equations to represent and solve problems involving linear relationships, such as earning rates and quantities of items.
- 🎓 The lesson concludes with a homework section that applies the concepts learned to match lines to statements, solve equations, and interpret data on a graph.
Q & A
What is the main topic of the video 'Math 8 Unit 4 Lesson 10'?
-The main topic of the video is to interpret the meaning of points in a coordinate plane and to solve problems related to it.
What is the activity involving four different graphs (A, B, C, and D) about?
-The activity is about identifying which graph doesn't belong with the others and explaining the reasoning behind the choice.
What characteristic distinguishes graph A from the other graphs in the first activity?
-Graph A has three sets of parallel lines with no intersections, unlike the other graphs which have intersections.
In the 'Pocket Full of Change' scenario, what is the total value of the coins Jada has in her pocket?
-Jada has two dollars worth of quarters and dimes in her pocket.
How many combinations of quarters and dimes can make up two dollars according to the table in the script?
-There are multiple combinations, including 20 dimes, 4 quarters and 10 dimes, 8 quarters, and 5 dimes and 2 quarters, among others.
What is the purpose of the graph in the 'Pocket Full of Change' scenario?
-The graph represents the relationship between the number of quarters and dimes when there are a total of 17 coins.
What is the conclusion for the 'Pocket Full of Change' scenario regarding the number of quarters and dimes Jada must have?
-Jada must have 2 quarters and 15 dimes to have a total of 17 coins valued at two dollars.
What is the pattern observed in the toothpick squares activity?
-The pattern is that the number of toothpicks needed is three times the number of squares plus one.
How does the video explain the concept of points on a line in a graph?
-The video explains that points on a line in a graph represent values that make the equation true, and discrete points indicate that you can't have fractions of items, like toothpicks or coins.
What is the method used in the video to solve for the number of hours May and Praia need to work to earn the same amount of money?
-The method involves setting up equations for their earnings and solving for the time (hours) when both equations are equal.
What is the significance of finding the point where two lines intersect on a graph?
-The point of intersection on a graph signifies the solution to the problem, where both equations are true, representing the same value or condition.
Outlines
📚 Math 8 Unit 4 Lesson 10 - Graph Analysis
This paragraph introduces a math lesson focusing on interpreting points in a coordinate plane. The lesson begins with an activity to identify which of four graphs (A, B, C, D) does not belong with the others based on their intersection patterns. Graph A has no intersections, B has one point of intersection, C has three lines intersecting at one point, and D has multiple intersections but not all three lines intersect together. The lesson also covers a 'pocket full of change' scenario where students must determine the combination of quarters and dimes that add up to two dollars using a table of combinations and a graph representing the relationship between the number of quarters and dimes with a total of 17 coins.
💰 Coin Combinations and Graph Interpretation
The paragraph delves into the 'pocket full of change' problem, where Jada has two dollars in quarters and dimes, totaling 17 coins. The task is to complete a table showing various combinations of quarters and dimes that equal two dollars and then to analyze a graph that represents the number of coins. The graph shows discrete points for each combination of quarters and dimes that sum to 17 coins. The paragraph explains how to determine the incorrect combination of four quarters and 13 dimes, which exceeds the two-dollar limit. The correct solution, based on the table and graph, is two quarters and 15 dimes, which equals 17 coins and two dollars.
📈 Graphing Progress: Signs for Spirit Week
This section discusses a scenario where Claire and Andre are making signs for an upcoming Spirit Week. The paragraph explains how to graph the progress of sign-making over time, with Andre starting with 15 signs and ending with 45, while Claire starts with five and ends with 65. The graph shows their progress, and the paragraph includes questions about the number of signs completed at specific times. The analysis reveals that at 40 minutes, both have made 25 signs, but by the end of the day, Claire has made more signs than Andre. The paragraph also addresses the false statement that at 100 minutes, 60 signs have been completed, as neither has reached that number by that time.
🏗️ Toothpick Squares and Linear Relationships
The paragraph explores a pattern in constructing squares with toothpicks, where the number of toothpicks needed is represented by the equation 3s + 1, where s is the number of squares. It provides examples of how many toothpicks are needed for different numbers of squares and reinforces the concept of linear relationships from a previous unit. The paragraph also touches on the application of these concepts to real-life situations, such as the cost of flour and sugar, and how equations and graphs can be used to find solutions where two conditions are met simultaneously.
📝 Homework Solutions: Analyzing Linear Equations
This paragraph provides a detailed walkthrough of solving a homework assignment involving linear equations and graphs. The task involves matching lines to statements about their coordinates, identifying sets of points that meet certain criteria, and explaining the process of solving equations without fractions. The paragraph includes specific examples, such as the line with points A, B, and C, and how to manipulate equations to eliminate fractions or find solutions for x.
🤔 Earnings Comparison: May and Pria's Side Jobs
The final paragraph presents a problem involving May and Pria, who earn money through different tasks. May earns a fixed amount per hour for mowing lawns and for hauling recyclables, while Pria earns a different rate per hour. The paragraph outlines how to set up equations to find out when they will have earned the same amount of money for the same number of hours worked. It also explains how to solve these equations to determine the number of hours and the total earnings, using tables, graphs, and equations to represent the hourly earnings and the point at which they are equal.
Mindmap
Keywords
💡Coordinate Plane
💡Intersection
💡Parallel Lines
💡Graphs
💡Combination
💡Dimes and Quarters
💡Discrete Points
💡Linear Relationships
💡Equations
💡Tables of Values
💡Mowing Lawns
💡Hauling Recyclables
Highlights
Introduction to interpreting the meaning of points in a coordinate plane.
Analysis of four different graphs to determine which one doesn't belong based on intersection points and line orientation.
Explanation of the concept of parallel lines and their lack of intersection in graph A.
Discussion on graph B's single point of intersection and its implications.
Graph C's three lines intersecting at one point, highlighting the positive x side.
Graph D's multiple intersections but not all three lines meeting, indicating a variety of differences.
Introduction to the 'Pocket Full of Change' problem involving quarters and dimes.
Completion of a table showing combinations of quarters and dimes worth two dollars.
Explanation of the relationship between the number of quarters and dimes with a total of 17 coins.
Analysis of point A on the graph representing eight quarters and nine dimes.
Determination that it is not possible for Jada to have four quarters and 13 dimes based on the value exceeding two dollars.
Solution to the 'Pocket Full of Change' problem: Jada must have two quarters and 15 dimes.
Introduction to the 'Making Science' problem involving signs made by Claire and Andre.
Analysis of the graph showing the progress of Claire and Andre in making signs.
Explanation of discrete points on the graph representing whole numbers of coins or signs.
Determination of the truth value of statements based on the graph for Andre and Claire's sign-making.
Introduction to the pattern in the 'Toothpicks Make One Square' problem.
Explanation of the equation 3s + 1 representing the number of toothpicks needed for s squares.
Introduction to the concept of linear relationships and their representation on a graph.
Analysis of the equation 4x - 4 = 4x + something, determining what could be written in the blank for no values to be true.
Introduction to May's earnings problem involving mowing lawns and hauling recyclables.
Solution to May's earnings problem, finding the number of hours worked and the total earnings.
Explanation of how to eliminate fractions in equations without solving them.
Transcripts
Browse More Related Video

Math 8 4 8 Homework Help Morgan
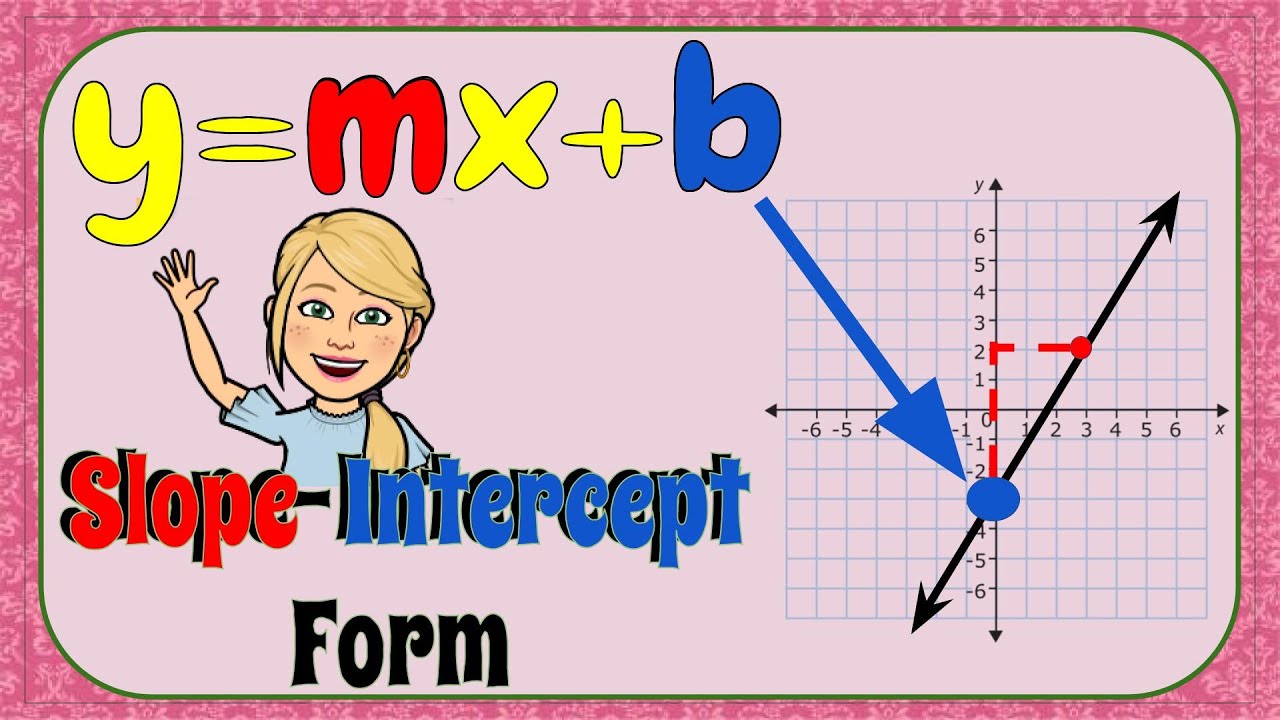
4 Steps to Graphing Slope-Intercept Form | 8.EE.B.6 💗
Intercepts and Traces of Surfaces (in 3D Space)
2022 Live Review 4 | AP Calculus AB | Integrals & Using the Fundamental Theorem of Calculus
Algebra Basics: Graphing On The Coordinate Plane - Math Antics

Math 8 4 9 Homework Help Morgan
5.0 / 5 (0 votes)
Thanks for rating: