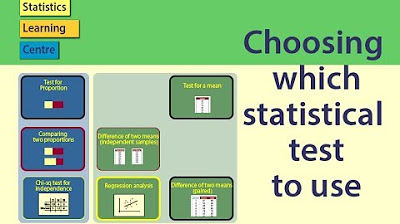
Choosing which statistical test to use: Practice examples
TLDRIn this educational video, Dr. NIC from Creative Maths introduces practice scenarios to help viewers choose the appropriate statistical test. Covering various examples, such as petrol consumption, employment duration, and faulty electronics, the video guides through selecting tests for mean comparison, two means difference, and proportion tests. Additional scenarios on recruitment assessment, sorting algorithms, and tester consistency further illustrate the application of regression analysis, paired and independent samples tests, and chi-squared tests for independence, providing a comprehensive guide to statistical analysis.
Takeaways
- 📚 The video is an educational resource from Dr. NIC of Creative Maths, focusing on statistical tests.
- 🚗 In the first example, a t-test is appropriate for comparing the mean petrol consumption against a claim.
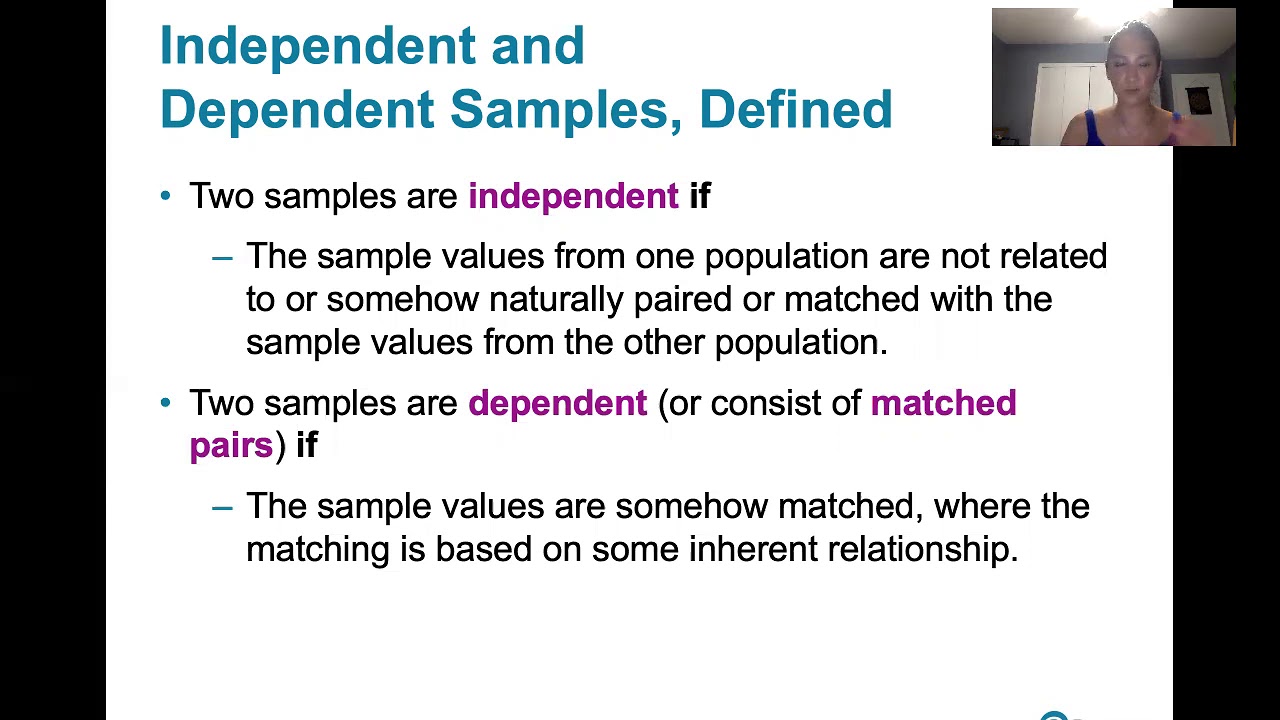
- 🎓 The second example involves comparing the mean length of employment between school leavers and others, using an independent samples t-test.
- 🔌 The third example requires a test for a proportion to determine if the fault rate in electronics is higher than the standard 1%.
- 📊 Example four suggests using regression analysis to predict the length of employment based on recruitment assessment marks.
- 🖥 In example five, a paired samples t-test is suitable for comparing the sorting times of two algorithms on the same databases.
- 🚗 Example six recommends using a test for the difference of two proportions to assess consistency between two vehicle testers.
- 🍰 The seventh example involves using a chi-squared test for independence to explore the relationship between group type and dessert ordering behavior.
- 🎮 Multi-vector game effectiveness in example eight is evaluated using a paired samples t-test to compare pre- and post-game scores.
- 📈 The ninth example, with a control group, uses an independent samples t-test to compare improvements in scores between two different learning methods.
- 🔑 The video encourages viewers to revisit the original video for more help and to ask questions in the comments if they find the material difficult.
Q & A
What is the main topic of the video script?
-The main topic of the video script is about choosing the appropriate statistical test to use in various scenarios based on the type of data and the purpose of the analysis.
What type of data is considered interval/ratio data or measurement data?
-Interval/ratio data or measurement data refers to data that can be measured on a numerical scale where the intervals between the measurements are consistent and the data includes a true zero point.
In the first example, what statistical test is suggested for analyzing the petrol consumption data?
-For the first example, the suggested statistical test is a t-test, which is used for comparing the mean of a sample against a known value or claim.
What is the purpose of the second example involving the employment of school leavers?
-The purpose of the second example is to determine whether there is a difference in the mean length of time that school leavers stay in the company compared to employees who have worked elsewhere.
What statistical test is appropriate for comparing the mean length of time between two groups in the second example?
-The appropriate statistical test for comparing the mean length of time between two groups in the second example is the independent samples t-test, also known as the two-sample t-test.
In the third example, what type of data is being recorded for each component?
-In the third example, nominal data is being recorded for each component, which indicates whether the component is faulty or not.
What statistical test is used to compare a sample proportion against a standard in the third example?
-The correct statistical test for comparing a sample proportion against a standard in the third example is the test for a proportion.
What is the purpose of the fourth example involving recruitment assessment?
-The purpose of the fourth example is to determine if there is a relationship between the mark on a recruitment assessment and the length of time an employee stays at the company, with the goal of predicting employment length.
Which statistical test is used to analyze the relationship between two interval/ratio variables in the fourth example?
-The statistical test used to analyze the relationship between two interval/ratio variables in the fourth example is regression analysis.
In the fifth example, what is the nature of the data collected for the sorting algorithms?
-The data collected for the sorting algorithms in the fifth example is interval/ratio data or measurement data, which records the time taken by the algorithms to sort the databases.
What statistical test is appropriate for comparing the performance of two different algorithms on the same set of problems in the fifth example?
-The appropriate statistical test for comparing the performance of two different algorithms on the same set of problems in the fifth example is the paired samples t-test, also known as the dependent samples t-test.
What is the main concern in the sixth example involving the vehicle testing station?
-The main concern in the sixth example is to determine if there is a significant difference in the consistency between the two testers at the vehicle testing station, based on the proportion of cars passed by each tester.
Which statistical test is used to compare the proportions of cars passed by two testers in the sixth example?
-The statistical test used to compare the proportions of cars passed by two testers in the sixth example is the test for the difference of two proportions.
In the seventh example, what type of data is being analyzed regarding the dessert habits of different groups?
-In the seventh example, nominal categorical data is being analyzed, which includes the type of group and whether or not they stayed for dessert.
What statistical test is used to determine if there is a relationship between the type of group and dessert ordering behavior in the seventh example?
-The chi-squared test for independence is used to determine if there is a relationship between the type of group and dessert ordering behavior in the seventh example.
What is the purpose of the eighth example involving the effectiveness of the 'Multi-Vector' game?
-The purpose of the eighth example is to compare the scores of learners on a multiplication test before and after playing the 'Multi-Vector' game to see if it improves performance.
Which statistical test is used to compare the pretest and post-test scores of the same group of learners in the eighth example?
-The paired samples t-test is used to compare the pretest and post-test scores of the same group of learners in the eighth example.
In the ninth example, what is the goal when comparing the improvements and scores between two groups of learners?
-The goal in the ninth example is to compare the change in score between the group of learners who played 'Multi-Vector' and the group who did times table worksheets to determine which method is more effective.
What statistical test is appropriate for comparing the changes in scores between two different groups of learners in the ninth example?
-The independent samples t-test is appropriate for comparing the changes in scores between two different groups of learners in the ninth example.
Outlines
🔍 Overview and Introduction
Dr. Nic from Creative Maths introduces the video on choosing statistical tests. This video builds on a previous one and provides practice scenarios. Dr. Nic outlines the structure of the video, which includes three examples where viewers can apply what they have learned about selecting appropriate statistical tests.
🚗 Example 1: Petrol Consumption
A car manufacturer claims that a specific model consumes less than five liters of petrol per 100 kilometers. The Automobile Association tests this claim by collecting data on petrol consumption from a sample of 30 cars. The correct statistical test for this scenario is a t-test for a mean, as it involves comparing a sample mean against a specified value.
🏢 Example 2: Employing School Leavers
A human resources manager collects data on 200 out of 3,000 past employees to determine if school leavers stay at the company longer than those who worked elsewhere. The test compares the means of two independent samples (school leavers and others), making the appropriate statistical test a t-test for the difference of two means.
📉 Example 3: Faulty Electronics
An electronics manufacturer checks if the fault rate in a sample of 300 components exceeds the allowed standard of 1%. This scenario involves comparing a sample proportion against a standard, so the correct test is a test for a proportion.
📈 Example 4: Recruitment Assessment
A human resources department wants to predict how long employees will stay based on their recruitment assessment marks. This scenario involves analyzing the relationship between two interval/ratio variables (assessment mark and duration of stay), thus requiring a regression analysis.
💻 Example 5: Sorting Algorithms
A computer scientist compares the performance of a new sorting algorithm against an existing one using 75 different databases. The test involves comparing the time taken by the two algorithms on the same set of databases, making the appropriate statistical test a paired samples t-test.
🚗 Example 6: Testing the Testers
An owner of a vehicle testing station examines if two testers have consistent pass rates. The data involves comparing proportions from two independent samples (the pass rates of the two testers). The correct statistical test here is the difference of two proportions test.
🍰 Example 7: Group Dessert Habits
A restaurant manager investigates if groups of women are more likely to order dessert than mixed or family groups. The data involves nominal variables (group type and dessert ordering), and the appropriate test is a chi-squared test for independence.
🧠 Example 8: Multi-Vector Effectiveness
Creative Maths tests the effectiveness of a game called Multi-Vector in improving multiplication skills. Forty learners are tested before and after using the game. This involves comparing the scores from two related samples, requiring a paired samples t-test.
🔍 Example 9: Effectiveness with Control Group
An experiment with 80 learners split into two groups evaluates the effectiveness of the Multi-Vector game. One group uses the game, while the other uses worksheets. Both groups are tested before and after the intervention, and the correct test is a t-test for the difference of means between the two independent samples.
Mindmap
Keywords
💡Statistical Test
💡Interval/Ratio Data
💡Claim
💡Sample
💡Mean
💡Difference of Two Means
💡Proportion
💡Chi-Squared Test
💡Regression Analysis
💡Paired Samples
💡Independent Samples
Highlights
Dr. NIC from Creative Maths introduces a video on choosing the right statistical test for different scenarios.
The video builds on a popular video and includes practice scenarios for better understanding.
Three scenarios are provided for viewers to test their knowledge on statistical tests.
Example 1 involves testing a car manufacturer's claim about petrol consumption using a t-test.
Example 2 explores comparing the mean length of employment for school leavers versus others using an independent samples test.
Example 3 discusses a test for a proportion to assess if the fault rate in electronics is higher than the standard.
Additional scenarios include predicting employment length based on recruitment assessment marks.
Example 5 compares sorting algorithms' efficiency using a paired samples test.
Example 6 investigates the consistency of vehicle testers using a test for two proportions.
The video provides guidance for viewers who find the material challenging, suggesting they revisit the original video.
Scenarios may repeat tests covered earlier to reinforce learning.
Example 7 examines the relationship between group type and dessert ordering behavior using a chi-squared test.
Example 8 assesses the effectiveness of a game on multiplication facts using a paired samples test.
Example 9 compares the effectiveness of a game versus worksheets with a control group using an independent samples test.
The video encourages viewers to ask questions in the comments for further clarification.
A call to action is made for viewers to subscribe and enable notifications for new video posts.
Transcripts
Browse More Related Video
Statistical Tests: Choosing which statistical test to use

SPSS (9): Mean Comparison Tests | T-tests, ANOVA & Post-Hoc tests
9.2.1 Two Means, Independent Samples - Independent and Dependent Samples

t-Test - Full Course - Everything you need to know
AP Statistics 2020 Review: Choosing Hypothesis Tests
Choosing a Statistical Test for Your IB Biology IA
5.0 / 5 (0 votes)
Thanks for rating: