equilibrium price and tax revenue after the imposition a per unit tax from Demand & Supply function
TLDRIn this mathematical economics video, the presenter solves a numerical problem to determine the impact of a per unit tax on the equilibrium price and demand and supply of burgers. Initially, the old equilibrium price and quantity are calculated using the given demand and supply functions. Subsequently, the video demonstrates how a per unit tax of 1.05 rupees shifts the supply curve, leading to a new equilibrium price of 4 rupees and a tax revenue of 216.3 rupees. The explanation includes both algebraic calculations and a graphical representation, providing a clear understanding of the effects of taxation on market dynamics.
Takeaways
- 📚 The video is part of a mathematical economics series focusing on the impact of a per unit tax on demand and supply dynamics.
- 🍔 The demand for burgers is represented by the function \( q = 286 - 20p \), where \( q \) is the quantity demanded and \( p \) is the price.
- 📈 The supply of burgers is given by the function \( q = 88 + 40p \), showing the relationship between price and quantity supplied.
- 🧩 To find the new equilibrium after a tax, the initial step is to calculate the old equilibrium price and quantity by setting demand equal to supply.
- 🔢 The old equilibrium price is calculated to be \( p = 3.3 \), and the corresponding quantity is \( q = 220 \).
- 💡 The introduction of a per unit tax shifts the supply curve to the left, changing the supply function to incorporate the tax.
- 📉 The new supply function after a tax of 1.05 rupees is \( p = -2.2 + 0.025q + 1.05 \).
- ⚖️ Equating the old demand function with the new supply function allows for the calculation of the new equilibrium quantity, which is \( q = 206 \).
- 📊 The new equilibrium price, after the tax imposition, is found to be \( p = 4 \).
- 💼 The tax revenue can be calculated by multiplying the tax rate (1.05 rupees) by the new quantity transacted (206 units), resulting in a revenue of 1216.3 rupees.
- 📈 The script also discusses the graphical representation of the impact of the tax, including the calculation of the area representing tax revenue.
Q & A
What is the initial demand function for burgers as described in the video?
-The initial demand function for burgers is given by q = 286 - 20p, where q is the quantity demanded and p is the price.
What is the initial supply function for burgers as described in the video?
-The initial supply function for burgers is given by q = 88 + 40p.
How is the equilibrium price calculated in the video?
-The equilibrium price is calculated by setting the demand function equal to the supply function and solving for p, which results in p = 3.3.
What was the equilibrium quantity before the tax was imposed?
-The equilibrium quantity before the tax was imposed was 220 units.
What happens to the supply curve when a per unit tax of 1.05 rupees is imposed?
-When a per unit tax of 1.05 rupees is imposed, the supply curve shifts to the left, reflecting the increased cost to suppliers.
How is the new equilibrium price determined after the tax is imposed?
-The new equilibrium price is determined by equating the old demand function with the new supply function after the tax, resulting in a new equilibrium price of 4 rupees.
What is the new equilibrium quantity after the tax is imposed?
-The new equilibrium quantity after the tax is imposed is 206 units.
How is the tax revenue calculated in the video?
-The tax revenue is calculated by multiplying the tax rate (1.05 rupees) by the new quantity transacted in the market (206 units), resulting in a tax revenue of 1216.3 rupees.
What is the graphical representation of the tax revenue in the video?
-The tax revenue is represented graphically as the area of a rectangle with a breadth of 1.05 (the tax rate) and a length of 206 (the new quantity transacted), which equals 1216.3 rupees.
What is the impact of the tax on the original supply function?
-The impact of the tax on the original supply function is that it is adjusted to account for the tax, resulting in a new supply function of p = -2.2 + 0.025q + 1.05.
How does the imposition of the tax affect the market equilibrium?
-The imposition of the tax leads to a decrease in the equilibrium quantity and an increase in the equilibrium price, indicating a shift in the market dynamics due to the tax.
Outlines
📚 Introduction to Mathematical Economics Problem
The video begins with an introduction to a mathematical economics problem focused on the impact of a per unit tax on demand and supply. The problem involves finding the new equilibrium price and tax revenue after a tax of 1.05 rupees per unit is imposed on burgers. The demand function is given by q = 286 - 20p, and the supply function by q = 88 + 40p. The video aims to find the old equilibrium price and quantity first, then analyze the effect of the tax on the supply curve.
🔍 Calculating the Old Equilibrium Price and Quantity
The video script explains the process of finding the old equilibrium price and quantity by setting the demand function equal to the supply function. After solving the equation 286 - 20p = 88 + 40p, the equilibrium price is found to be p = 3.3. Substituting this value back into either the demand or supply function gives an equilibrium quantity of q = 220. This establishes the baseline before the tax is imposed.
📉 Impact of Per Unit Tax on Supply Curve
The script then discusses the impact of a per unit tax on the supply curve. The original supply function is transformed into an inverse supply function to accommodate the tax. The new supply function is derived by adding the tax of 1.05 rupees to the inverse supply equation, resulting in a leftward shift of the supply curve. The video illustrates this graphically and explains how to find the new equilibrium by setting the old demand function equal to the new supply function after the tax.
📈 Determining New Equilibrium and Tax Revenue
The new equilibrium quantity is calculated to be 206 units by solving the set of equations involving the old demand and new supply functions. The new equilibrium price is found to be 4 rupees by substituting the new quantity into the inverse demand function. The tax revenue is then calculated as the product of the tax rate and the quantity transacted, resulting in a revenue of 12,163 rupees. The script also describes how to graphically determine the tax revenue by calculating the area of a rectangle formed by the price difference and the quantity transacted.
🏦 Conclusion on Tax Revenue and Graphical Representation
The video concludes by summarizing the tax revenue calculation and providing a graphical representation of the revenue area. The script explains how to calculate the area under the new equilibrium price and above the old supply curve to find the government's revenue from the tax imposition. The video ends with a thank you note, ensuring that the explanation was clear and comprehensive.
Mindmap
Keywords
💡Equilibrium Price
💡Equilibrium Quantity
💡Per Unit Tax
💡Tax Revenue
💡Demand Function
💡Supply Function
💡Inverse Demand Function
💡Inverse Supply Function
💡New Supply Function
💡Graphical Representation
Highlights
Introduction to solving a numerical problem on tax revenue and the impact of per unit tax on demand and supply in the context of mathematical economics.
The demand function for burgers is given by \( q = 286 - 20p \), where \( q \) is the quantity demanded and \( p \) is the price.
The supply function is similarly given by \( q = 88 + 40p \).
Finding the old equilibrium price and quantity by setting the demand function equal to the supply function.
Calculating the equilibrium price to be \( p = 3.3 \) by solving the equation \( 286 - 88 = 60p \).
Determining the equilibrium quantity to be \( q = 220 \) by substituting \( p = 3.3 \) into the demand function.
Impact of a per unit tax of 1.05 rupees on the supply curve, causing it to shift to the left.
Transformation of demand and supply functions into inverse functions to analyze the impact of the tax.
Derivation of the new supply function after the imposition of the tax, incorporating the tax rate into the equation.
Graphical representation of the shift in the supply curve due to the tax.
Finding the new equilibrium price by equating the old demand function with the new supply function.
Calculation of the new equilibrium quantity to be \( q = 206 \) after the tax imposition.
Determination of the new equilibrium price to be \( p = 4 \) after the tax.
Explanation of how to calculate tax revenue as the product of the tax rate and the quantity transacted.
Calculation of the total tax revenue to be 1216.3 rupees after the tax imposition.
Graphical method to calculate the tax revenue by finding the area of the rectangle formed by the price difference and quantity.
Conclusion summarizing the effects of the per unit tax on equilibrium price, quantity, and tax revenue.
Transcripts
Browse More Related Video
Taxation and dead weight loss | Microeconomics | Khan Academy
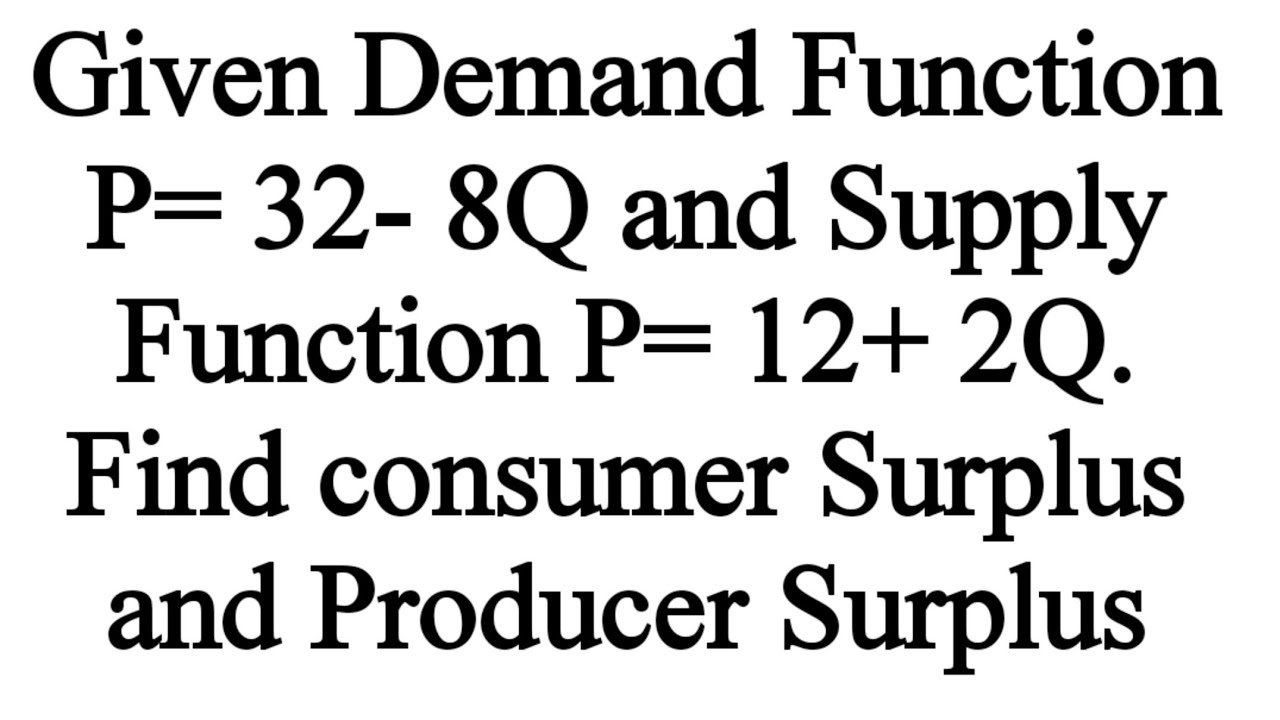
consumer surplus and producer surplus

Market equilibrium | Supply, demand, and market equilibrium | Microeconomics | Khan Academy
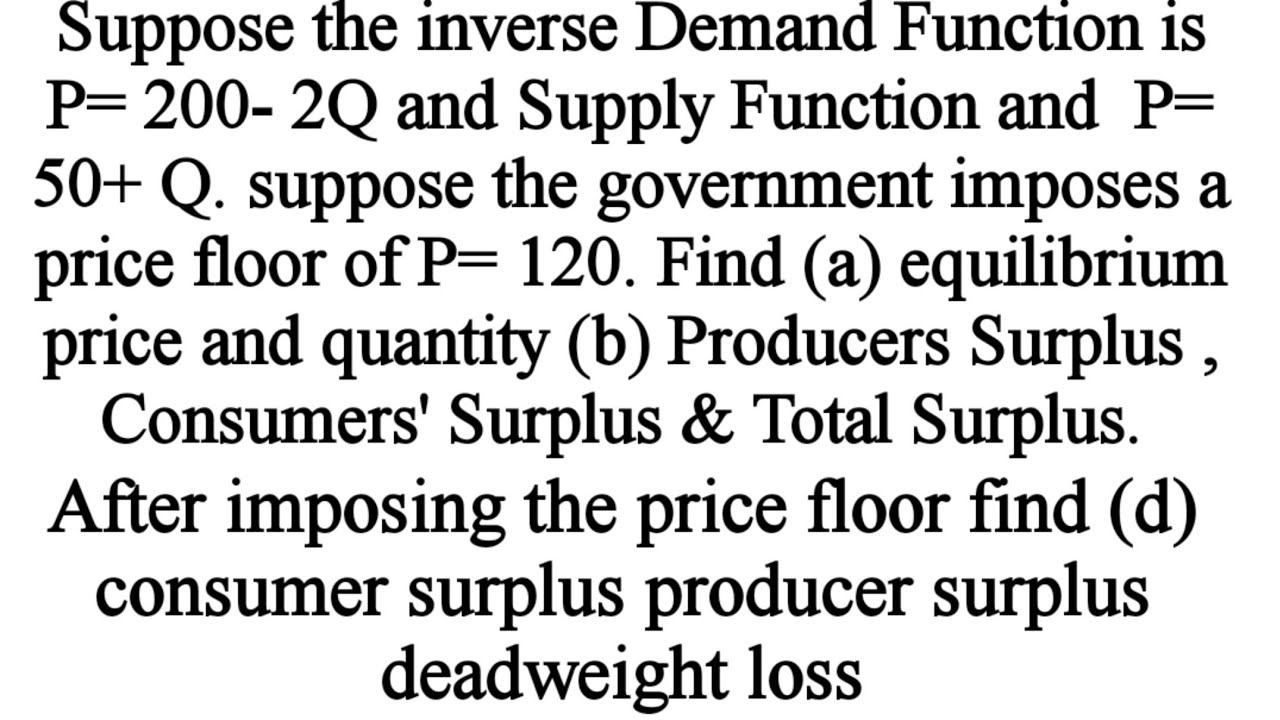
Consumers 'surplus Producers' Surplus , Total surplus, deadweight loss with price floor
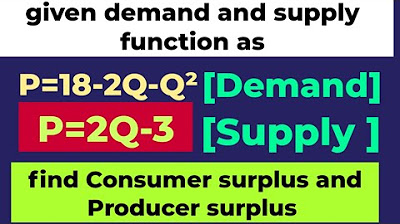
Consumers' Surplus , Producers' Surplus & Total Surplus from demand & supply Functions #PS

supply demand in equilibrium
5.0 / 5 (0 votes)
Thanks for rating: