Intermediate Microeconomics: Consumer surplus, producer surplus, price controls, and taxes, Part 1
TLDRThis video script delves into economic concepts of consumer and producer surplus, explaining how they measure the well-being of buyers and sellers in a market. It explores the impacts of government interventions such as price floors, ceilings, taxes, and subsidies on these surpluses, using graphical analysis to illustrate the effects on market equilibrium. The discussion highlights the inefficiencies and potential harms of such policies, advocating for alternative approaches like targeted subsidies to protect consumers and workers without disrupting market signals.
Takeaways
- 📊 Consumer Surplus is a measure of the well-being of buyers in a market, representing the difference between what they are willing to pay and what they actually pay.
- 💰 Willingness to Pay (WTP) is used to measure the value consumers place on a good or service, and it is represented by the demand curve, showing the marginal value at different quantities.
- 📉 The demand curve reflects the marginal willingness to pay for each additional unit of a good; as quantity increases, the willingness to pay for each additional unit decreases.
- 🛒 Consumer Surplus is the area under the demand curve and above the market price, indicating the total value consumers gain from purchasing a good at a price lower than their WTP.
- 💼 Producer Surplus represents the well-being of sellers in a market, calculated as the area under the market price and above the supply curve, reflecting the difference between the price received and the cost of production.
- 🔄 The equilibrium price and quantity in a market are determined by the intersection of the demand and supply curves, indicating the point where the quantity supplied equals the quantity demanded.
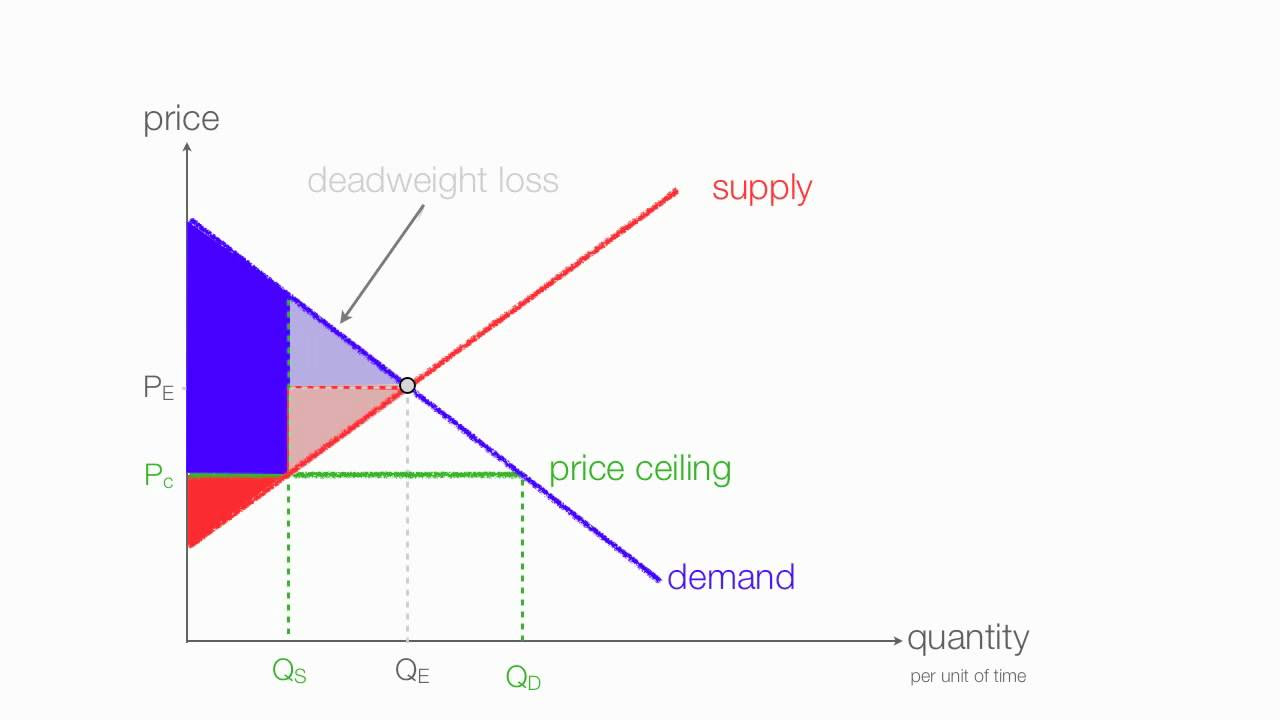
- 🚫 Price ceilings are legislated maximum prices set by the government to protect buyers from high prices, but they can lead to shortages and inefficiencies if set below the equilibrium price.
- 📈 Price floors are legislated minimum prices, such as minimum wages, which can create surpluses and unemployment if set above the equilibrium price in labor markets.
- 🚶♂️ Surpluses caused by price floors and ceilings do not disappear over time; instead, they can lead to persistent inefficiencies and require alternative rationing mechanisms, such as lines or black markets.
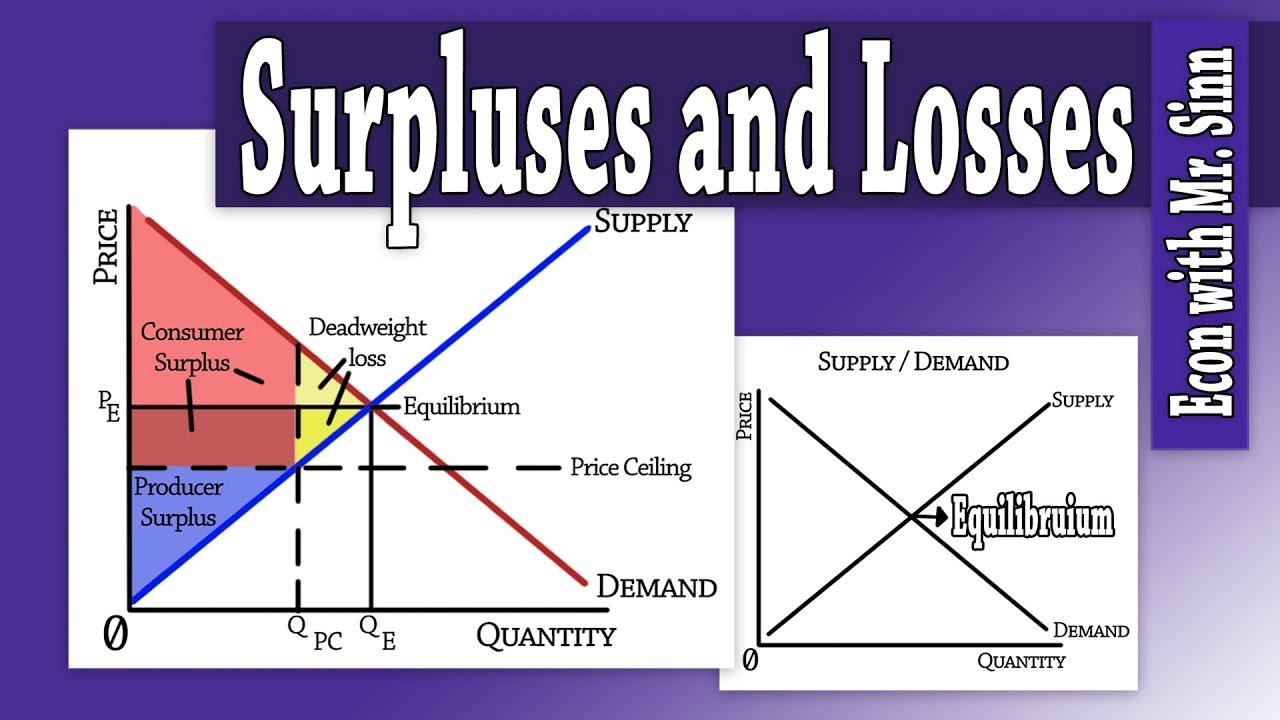
- 💔 Both price floors and ceilings result in deadweight loss, which is the reduction in total surplus due to market inefficiencies caused by government intervention in price determination.
- 🛑 Quotas are quantity restrictions set by the government, similar to price floors and ceilings in their impact, leading to increased prices, reduced consumer surplus, and potential deadweight loss.
Q & A
What is consumer surplus and why is it important in measuring the well-being of buyers?
-Consumer surplus is the difference between how much buyers are willing to pay for a good or service and how much they actually pay. It is important because it measures the well-being or economic welfare of buyers, indicating the extra value they receive from a transaction beyond what they had to pay.
How is willingness to pay (WTP) related to the concept of consumer surplus?
-Willingness to pay is a measure of the value a consumer places on a good or service. Consumer surplus arises when consumers pay less than their WTP, thus gaining additional value from the transaction.
What is the difference between willingness to pay and willingness to accept?
-Willingness to pay is the amount a consumer is willing to give up to acquire a good, whereas willingness to accept is the amount a consumer requires to be compensated to give up a good they already possess.
How does the demand curve represent the marginal willingness to pay?
-The height of the demand curve at a particular quantity indicates the marginal willingness to pay for that quantity. As quantity increases, the marginal willingness to pay typically decreases, reflecting the law of diminishing marginal utility.
What is the relationship between consumer surplus and the area under the demand curve?
-Consumer surplus is represented by the area under the demand curve and above the market price up to a certain quantity. It is the total value that consumers derive from consuming the good, minus the amount they actually pay for it.
Can you explain the concept of producer surplus?
-Producer surplus is the difference between the market price at which a good is sold and the minimum price producers are willing to accept. It represents the extra profit or benefit that producers gain from selling their goods above their cost of production.
How does a price floor affect consumer and producer surplus?
-A price floor, if set above the equilibrium price, creates a surplus of goods as the quantity supplied exceeds the quantity demanded. This reduces consumer surplus and can increase producer surplus, but also leads to deadweight loss due to the inefficiency caused by the price control.
What is the impact of a price ceiling on the market?
-A price ceiling, if set below the equilibrium price, restricts the market price that can be charged, leading to a shortage. This can reduce producer surplus and may increase consumer surplus, but also results in deadweight loss and can lead to the emergence of alternative rationing mechanisms like queues or black markets.
What are some alternative policies to price floors and ceilings that can protect buyers and sellers without fixing prices?
-Subsidies and targeted financial assistance, such as wage subsidies or rent subsidies, can be used to protect buyers and sellers without distorting market prices. These policies aim to provide support directly to those who need it, rather than implementing broad market interventions.
How do quotas as a government policy affect market outcomes?
-Quotas fix the quantity of a good that can be produced or sold in a market. This can lead to an increase in price and a decrease in consumer surplus, as well as a potential increase in producer surplus, assuming the quota is set at a level where demand exceeds the fixed supply. However, it also results in deadweight loss due to market inefficiencies.
What is the economic concept of deadweight loss and how is it related to price controls and quotas?
-Deadweight loss refers to the reduction in economic welfare or surplus that occurs when a market is not allowed to clear at its equilibrium price due to government interventions like price controls or quotas. It represents the loss of consumer and producer surplus that cannot be recouped through any form of reallocation.
Outlines
📚 Introduction to Consumer and Producer Surplus
This paragraph introduces the concepts of consumer surplus (CS) and producer surplus, explaining how they measure the well-being of buyers and sellers in a market. Consumer surplus is the difference between what consumers are willing to pay (WTP) and what they actually pay. It's illustrated using a demand curve, where the height of the curve represents the marginal WTP. The total value consumers get from a good is the area under the demand curve up to a certain quantity, and consumer surplus is the area between this curve and the market price. The paragraph also touches on willingness to accept, which is the minimum compensation a consumer would require to part with a good, and how it relates to the supply side of the market.
💰 Understanding Consumer and Producer Surplus Calculation
The second paragraph delves deeper into the calculation of consumer surplus, which is the leftover value after paying for goods, represented as the area under the demand curve and above the market price. It contrasts this with producer surplus, which is the area under the price and above the supply curve, indicating the difference between the market price and the cost of production. The paragraph explains that the supply curve in a competitive market represents the marginal cost curve, and the total cost of production is the area under this curve up to a certain quantity. It also discusses the relationship between total revenue, price, and quantity, and how producer surplus is the difference between total revenue and total cost.
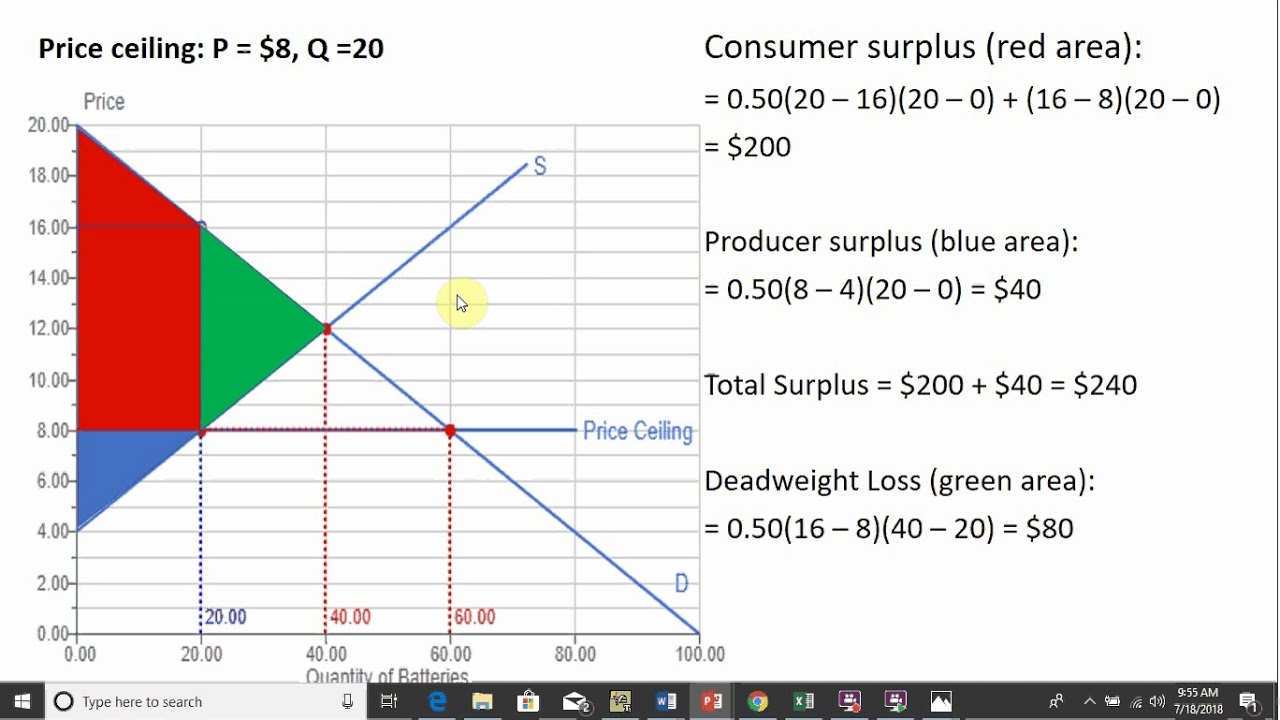
📉 Example Calculation of Surplus with Demand and Supply Curves
In this paragraph, an example is provided to calculate consumer and producer surplus using specific demand and supply curves. The demand curve is given by the equation quantity demanded = 500 - 100p, and the supply curve by the equation quantity supplied = -100 + 100p. The equilibrium price and quantity are found by setting these curves equal to each other, resulting in a price of $3 and a quantity of 200 units. The paragraph guides through the process of graphing these inverse relationships and using them to find the areas of consumer and producer surplus at the market equilibrium.
🚫 Impact of Price Controls on Market Surplus
The fourth paragraph discusses the effects of price controls, such as price ceilings and floors, on consumer and producer surplus. It explains that a price ceiling, if set below the equilibrium level, creates a shortage and a binding price floor results in a surplus. The paragraph highlights the inefficiencies caused by these policies, such as the emergence of alternative rationing mechanisms like queues, discrimination, and black markets. It emphasizes that these policies do not protect consumers or sellers as intended but instead lead to a misallocation of resources and a reduction in overall economic welfare.
🛍️ The Role of Price in Allocating Goods in a Free Market
This paragraph explores the role of price in a free market, explaining how it acts as a signal for buyers and sellers to make decisions about purchasing or selling goods. It clarifies that price does not dictate these decisions but emerges from market interactions. The paragraph contrasts the efficiency of price allocation with the inefficiencies of alternative rationing mechanisms that arise when price controls are imposed. It also touches on the concept of total surplus maximization in a free market and the conditions under which government intervention might improve market outcomes.
📉 Effect of Price Ceilings on Consumer and Producer Surplus
The sixth paragraph examines the specific impact of price ceilings on consumer and producer surplus. It uses a diagram to illustrate the loss of surplus due to the imposition of a price ceiling, showing the transfer of wealth from sellers to buyers and the creation of deadweight loss. The paragraph explains that while some consumers may benefit from the lower price, the overall effect is a reduction in economic welfare and the emergence of inefficient rationing mechanisms.
🚶♂️ The Consequences of Price Floors and Alternative Protections
The seventh paragraph discusses the consequences of price floors, such as unemployment in the labor market when the minimum wage is set too high. It also considers alternative methods to protect buyers and sellers, such as subsidies, which can be more effective without distorting market prices. The paragraph emphasizes the importance of avoiding policies that fix prices, as they lead to inefficiencies and a reduction in the economic pie.
🏭 Impact of Quantity Regulations and Quotas on Market Surplus
The eighth paragraph explores the effects of quantity regulations, such as quotas, on consumer and producer surplus. It explains how a quota sets a limit on the quantity that can be produced or sold, leading to a vertical supply curve at the quota level and an increase in price. The paragraph illustrates the resulting changes in consumer and producer surplus, highlighting the transfer of wealth and the creation of deadweight loss due to the inefficiencies introduced by such regulations.
💡 Conclusion and Preview of Upcoming Tax Policy Discussion
In the final paragraph, the video script concludes the discussion on price floors and quantity regulations, emphasizing their negative impacts on market surplus and economic efficiency. It previews the next topic, which will be the impact of taxes on a market, promising a detailed analysis of how taxes affect consumer and producer surplus, and the calculation of these effects using demand and supply curves.
Mindmap
Keywords
💡Consumer Surplus
💡Producer Surplus
💡Willingness to Pay (WTP)
💡Price Ceiling
💡Price Floor
💡Equilibrium Price
💡Demand Curve
💡Supply Curve
💡Deadweight Loss
💡Quota
Highlights
Introduction to concepts of consumer surplus, producer surplus, and government interventions in markets.
Explanation of consumer surplus as a measure of buyers' well-being in a market.
Willingness to pay (WTP) as a measure of value and its relation to the demand curve.
Illustration of how the demand curve represents marginal willingness to pay.
Calculation of consumer surplus as the area between the demand curve and market price.
Definition of producer surplus and its calculation relative to the supply curve.
Example calculation of consumer and producer surplus using given demand and supply curves.
Discussion on government interventions such as price floors, ceilings, taxes, and subsidies.
Analysis of the effects of price ceilings on market equilibrium and consumer surplus.
Impact of price ceilings on producer surplus and the creation of deadweight loss.
Price floors and their role in creating persistent surpluses and unemployment.
Welfare impacts of price floors on consumer and producer surplus.
Comparison of price ceilings and floors in terms of their effects on economic welfare.
Introduction to alternative policies like subsidies as more efficient ways to protect buyers and sellers.
Critique of quantity regulations and their similarity to price controls in creating inefficiencies.
Overview of the effects of quotas on consumer and producer surplus and the emergence of deadweight loss.
Preview of the next video's focus on the impact of taxes on markets and surplus measures.
Transcripts
Browse More Related Video
How to calculate changes in consumer and producer surplus with price and floor ceilings.

Animation on How to Price Floors and Price Ceilings
Consumer/Producer Surplus & Deadweight Loss
Price Ceiling: Consumer Surplus, Producer Surplus, & Deadweight loss
Chapter 7: Consumer Surplus, Producer Surplus and the Efficiency of Markets - Part 1

Micro: Unit 1.6 -- Consumer Surplus, Producer Surplus, and Deadweight Loss
5.0 / 5 (0 votes)
Thanks for rating: