SPSS: Understand Ordinal, Nominal & Scale (aka Level of measurment)
TLDRThis video script emphasizes the importance of correctly identifying the level of measurement in SPSS for accurate data analysis. It outlines three types: nominal, ordinal, and scale. Nominal is for categories without order, like gender; ordinal is for ordered categories, like age groups; and scale is for ungrouped numerical data, like age or income. Misclassification can lead to incorrect SPSS functionalities and statistical tests. The speaker advises against the common mistake of misclassifying ordinal data as scale and stresses the need for correct classification to ensure appropriate data visualization and analysis.
Takeaways
- 📊 The level of measurement in SPSS is crucial for data analysis and should not be overlooked.
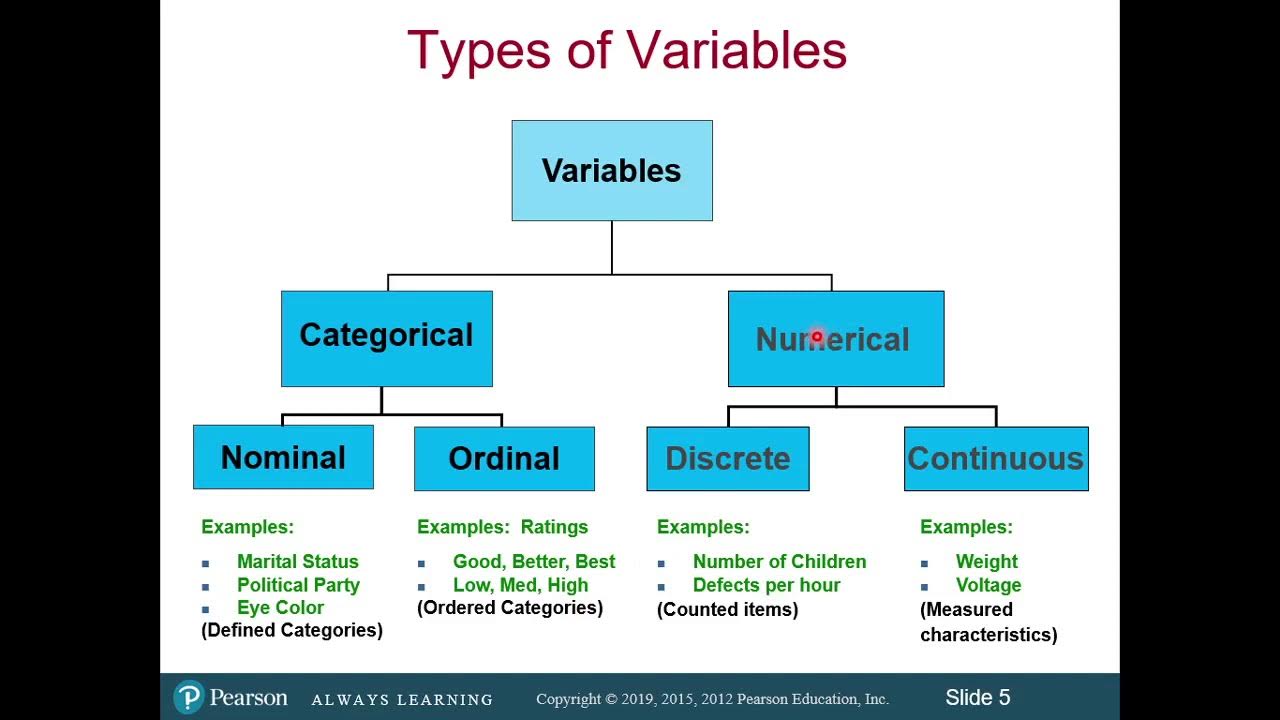
- 🔢 There are three levels of measurement in SPSS: nominal, ordinal, and scale.
- 📝 Quantitative or closed-ended questions can be categorized as either categorical or scale data.
- 📑 Categorical data includes ordinal (with meaningful rank or order) and nominal (without meaningful rank or order).
- 🔡 Ordinal data examples include age groups and Likert scale responses, which have a clear order.
- 🚫 A common mistake is misclassifying Likert scales as scale data due to the word 'scale' in their name.
- 🎯 Ordinal data should initially be treated as ordinal, with normality tests conducted afterward if necessary.
- 🚷 Nominal data includes categories like marital status and gender that cannot be ranked or ordered.
- 📈 Scale data refers to numerical data that is not grouped, such as age, height, weight, and income.
- ❌ Incorrectly classifying data can lead to SPSS not allowing certain types of charts or analyses.
- 🧐 The choice of statistical tests and descriptive statistics should be based on the level of measurement of the data.
Q & A
Why is the level of measurement important in SPSS?
-The level of measurement is important in SPSS because it determines the type of statistical analysis and graphical representations that can be performed. Incorrect classification can lead to inappropriate analysis choices and errors in data visualization.
What are the three levels of measurement in SPSS?
-The three levels of measurement in SPSS are nominal, ordinal, and scale. Nominal data has categories without a meaningful order, ordinal data has categories with a meaningful order, and scale data is numerical and not grouped.
What is categorical data in the context of SPSS?
-Categorical data in SPSS refers to data that can be categorized into groups or categories. It can be further divided into ordinal or nominal based on whether the categories have a meaningful rank or order.
Can you provide an example of ordinal data?
-An example of ordinal data would be age groups such as 18 to 24, 25 to 30, and 31 to 35, where the groups have a meaningful rank or order.
What is the common mistake students make regarding the classification of likert scales?
-A common mistake is classifying likert scales as scale data because of the word 'scale' in their name. However, likert scales are ordinal data because they have a meaningful rank or order of agreement.
What is nominal data and can you give an example?
-Nominal data consists of categories without a meaningful rank or order. Examples include marital status (single, married, divorced, widowed, separated) and gender (male, female).
How is scale data different from categorical data?
-Scale data is numerical and not grouped, such as age, height, weight, or income. In contrast, categorical data is grouped into categories and can be either nominal or ordinal.
Why is it incorrect to classify nominal data as scale when creating a bar chart in SPSS?
-If nominal data is classified as scale, SPSS will attempt to create a histogram instead of a bar chart, which is not appropriate for nominal data and can lead to misinterpretation of the results.
How does the level of measurement affect the choice of statistical tests?
-The level of measurement affects the choice of statistical tests because certain tests are designed for specific levels of data. For example, a t-test is used for scale data, while non-parametric tests are used for ordinal data.
What should be done if ordinal data is normally distributed?
-If ordinal data is normally distributed, some textbooks suggest it can be classified as scale data. However, it's recommended to initially classify it as ordinal and then perform normality tests and analysis as needed.
Outlines
📊 Importance of Measurement Levels in SPSS
The speaker emphasizes the importance of correctly identifying the level of measurement in SPSS, which includes nominal, ordinal, and scale. They argue against the common misconception that one should disregard the level of measurement. The video aims to define these levels and explain their significance in data analysis. The speaker will also discuss why misclassification can lead to incorrect analysis and visualization in SPSS.
📚 Understanding Categorical and Scale Data in SPSS
This paragraph delves into the specifics of categorizing data in SPSS. The speaker explains that quantitative data can be classified as either categorical or scale. Categorical data is further divided into ordinal and nominal based on whether the categories have a meaningful rank or order. Examples such as age groups and likert scales are given to illustrate ordinal data, while marital status and gender are used to explain nominal data. The speaker also clarifies a common mistake of misclassifying likert scales as scale data due to their name.
🔍 Correct Classification for Accurate SPSS Analysis
The speaker stresses the necessity of correct data classification for proper analysis in SPSS. They mention that misclassifying ordinal data as scale can lead to incorrect statistical tests and analysis. The paragraph also touches on the idea that ordinal data can be treated as scale if it is normally distributed, but this should be verified with normality tests. The speaker provides examples of nominal data like yes/no questions and scale data like age, height, and income, which are not grouped and should be treated as numerical data.
🛠️ Impact of Measurement Levels on SPSS Capabilities and Analysis Choices
The final paragraph discusses the practical implications of incorrect data classification in SPSS. The speaker explains that SPSS will not allow certain visualizations like bar charts if the data is misclassified. Moreover, the choice of statistical tests is dependent on the level of measurement, with scale data allowing for parametric tests like t-tests and ordinal data requiring non-parametric tests. The speaker concludes by reiterating the importance of accurate measurement level classification for both SPSS functionality and the selection of appropriate analytical methods.
Mindmap
Keywords
💡Level of Measurement
💡SPSS
💡Nominal
💡Ordinal
💡Scale
💡Categorical Data
💡Quantitative Data
💡Statistical Inferential Tests
💡Descriptive Statistics
💡Bar Chart
💡Histogram
Highlights
The importance of correctly identifying the level of measurement in SPSS.
Three levels of measurement in SPSS: nominal, ordinal, and scale.
Quantitative or closed-ended questions can be categorized as either categorical or scale.
Categorical data can be further divided into ordinal and nominal types.
Ordinal categories have a meaningful rank or order, such as age groups.
Liquor scale type questions are considered ordinal due to their meaningful rank.
Common mistake: classifying liquor scales as scale due to the word 'scale'.
Ordinal data should initially be classified as ordinal before normality tests.
Nominal categories lack a meaningful rank or order, such as marital status or gender.
Yes/no questions are typically nominal as they do not have a meaningful rank.
Scale data is numerical data that is not grouped, such as age or income.
SPSS will not allow creating a bar chart with nominal data classified as scale.
Statistical tests and descriptive statistics should be chosen based on the level of measurement.
Scale data allows for parametric tests like t-tests, assuming normality and equal variance.
Ordinal data requires non-parametric tests due to its nature.
Level of measurement affects what SPSS allows you to do and the analysis choices.
Transcripts
Browse More Related Video

Introduction to Levels of Measurement: Nominal, Ordinal, Interval, Ratio

Classification of Variables and Types of Measurement Scales

Types of Data: Nominal, Ordinal, Interval/Ratio - Statistics Help

Data Types - Levels of Data Measurements - Nominal Ordinal Interval Ratio | Statistics | Research

Nominal, Ordinal, Interval & Ratio Data: Simple Explanation With Examples

Scales of Measurement - Nominal, Ordinal, Interval, & Ratio Scale Data
5.0 / 5 (0 votes)
Thanks for rating: