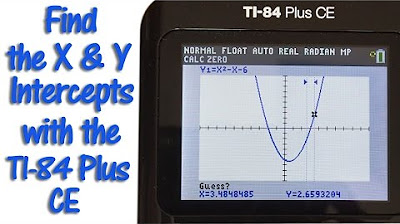
Lesson 6.4 - Finding Zeros, Relative Min, Relative Max (Graphing Calculator - Guided Example 1)
TLDRThis instructional video script guides viewers on utilizing a graphing calculator to analyze polynomial functions, specifically focusing on finding relative maxima, minima, and zeros. The presenter demonstrates how to input a given polynomial function into the calculator and use the 'standard zoom' feature to visualize the graph. The process of identifying zeros involves marking points left and right of each x-intercept. To find relative extrema, the script details the use of the 'calculate' menu, emphasizing the importance of selecting appropriate bounds and making an educated guess. The video concludes by highlighting the calculator's limitations in precision and the significance of understanding scientific notation when interpreting results.
Takeaways
- 📚 Start by familiarizing yourself with using a graphing calculator to assist in analyzing polynomial functions.
- 🔍 Input the polynomial function x^4 - x^3 - 4x^2 + 1 into the calculator's 'y1' to begin graphing.
- 📐 Use the 'standard zoom' feature (option 6) to set the x-axis range from -10 to 10 and y-axis range from -10 to 10 for a clear view of the graph.
- 🎯 To find zeros (x-intercepts), use the 'calculate' menu's 'zero' feature, marking a point to the left and right of each zero.
- 📝 The process for finding zeros involves entering the '2nd calc' mode, selecting 'zero', and marking left and right bounds before pressing 'enter' for the guess.
- 📉 To determine relative minimum values, use the 'minimum' option in the 'calculate' menu, following the same left bound, right bound, and guess procedure.
- 📈 Similarly, to find relative maximum values, use the 'maximum' option in the 'calculate' menu with the same marking process.
- 🤔 The calculator provides approximations for relative extrema, which may appear as very small numbers in scientific notation but are essentially zero.
- 🔑 The general process for finding any specific value on a graph involves using the 'calculate' menu with a left bound, right bound, and a guess.
- 🔍 The script emphasizes the importance of understanding how to use the calculator's features to find zeros, relative minima, and maxima of polynomial functions.
Q & A
What is the purpose of the video script?
-The purpose of the video script is to guide viewers on how to use a graphing calculator to find relative maximum, relative minimum, and zeros of polynomial functions.
Which polynomial function is used in the script for demonstration?
-The polynomial function used for demonstration is x^4 - x^3 - 4x^2 + 1.
How does one set the window size on the graphing calculator to a standard range?
-To set the window size to a standard range from negative 10 to 10, one should use the 'Zoom' option and select '6: ZStandard'.
What is the first step to find the zeros of a polynomial function on a graphing calculator?
-The first step to find the zeros is to use the 'Second Trace' feature and then select the 'Zero' feature from the calculate menu.
How many zeros does the polynomial function in the script have?
-The polynomial function in the script has four zeros.
What is the process to find a zero using the graphing calculator?
-The process involves marking a point to the left and to the right of the zero, and then using the 'Guess' option to find the approximate zero value.
How many relative minimums are there in the graph of the polynomial function shown in the script?
-There are two relative minimums in the graph of the polynomial function.
What is the step to find the relative minimums on a graphing calculator?
-To find the relative minimums, use the 'Second Trace' feature and select '3: Minimum' from the calculate menu, then follow the left bound and right bound process with a guess.
What does the script say about the relative maximum in the graph?
-The script mentions that there is a relative maximum in the graph, and it can be found using the 'Second Trace' feature and selecting '4: Maximum' from the calculate menu.
Why might the calculator's approximation of a relative maximum value be difficult to understand?
-The calculator's approximation might be in scientific notation, showing a very small number like '1e-6', which can be confusing. It represents 0.000001 and is an approximation of the actual relative maximum value.
What is the general process for finding any specific value on a graph using a graphing calculator?
-The general process involves going to the 'Calculate' menu, selecting the appropriate feature (0 for zero, 3 for minimum, 4 for maximum), and then marking a left bound, a right bound, and using a guess to find the specific value.
Outlines
📊 Graphing Calculator Tutorial for Polynomial Functions
This paragraph provides a step-by-step guide on utilizing a graphing calculator to analyze polynomial functions, specifically focusing on finding zeros, relative maxima, and minima. The user is instructed to input a given polynomial function into the calculator's 'y1' and adjust the window size for clarity. The process of finding zeros involves using the calculator's second trace and zero feature, marking points to the left and right of each zero and obtaining their approximate values. The guide also covers finding relative minimum and maximum values using the calculate menu's minimum and maximum features, which similarly require marking left and right bounds and guessing to approximate the values. The importance of understanding the calculator's functionality is emphasized for analyzing polynomial graphs effectively.
📚 Detailed Explanation of Finding Relative Extrema on a Graphing Calculator
The second paragraph continues the tutorial on using a graphing calculator, this time concentrating on identifying relative extrema, which are the highest and lowest points on a graph. The user is guided through the process of finding relative minimums by selecting the appropriate option on the calculator and marking left and right bounds around the minimum points. The process is repeated for each minimum point detected on the graph. Additionally, the paragraph explains how to find a relative maximum, which involves similar steps of marking bounds and guessing the value. The tutorial highlights a potential challenge with the calculator's precision, noting that it may approximate very small values, and emphasizes the importance of understanding scientific notation when interpreting the results. The paragraph concludes with a brief mention of a further example to reinforce the concepts learned.
Mindmap
Keywords
💡Graphing Calculator
💡Polynomial Function
💡Relative Maximum
💡Relative Minimum
💡Zeros
💡Second Trace
💡Zoom
💡Calculate Menu
💡Left Bound and Right Bound
💡Scientific Notation
Highlights
Introduction to using a graphing calculator for analyzing polynomial functions.
Guiding examples to refresh memory on graphing calculator usage.
How to input a polynomial function into the calculator (x^4 - x^3 - 4x^2 + 1).
Setting window size to -10 to 10 for minimum and maximum values.
Using the standard zoom feature for initial graph visualization.
Finding zeros or x-intercepts of the polynomial function.
Utilizing the second trace and calculate menu for zero feature.
Marking a point to the left and right of each zero for calculation.
Calculating the first zero at -1.44.
Repeating the process to find subsequent zeros.
Identifying a total of four zeros for the given polynomial.
Transitioning to finding relative minimum and maximum values.
Using the calculate menu to find minimum values on the graph.
Marking left and right bounds to calculate minimum values.
Calculating two relative minimum values: -1.095 and -1.84.
Explaining the process for finding relative maximum values.
Using left and right bounds to approximate the relative maximum.
Understanding scientific notation and calculator approximations.
General process for finding any specific value on a graph using the calculate menu.
Summary of the steps involved in using the graphing calculator effectively.
Transcripts
5.0 / 5 (0 votes)
Thanks for rating:


