Ex: Model Daily Temperatures Using a Trig Function
TLDRThe video script discusses modeling daily temperature fluctuations using a sinusoidal function. It starts by establishing the midline at 80 degrees, the average of the day's high (96 degrees) and low (64 degrees) temperatures. The script then uses the given information about the low temperature occurring at 4 AM and the period of 24 hours to plot key points on the graph. By recognizing the graph as a transformation of the cosine function, the video derives the equation for temperature, D(t) = -16 cos(π/12 (t - 4)) + 80, which accurately represents the temperature over a 24-hour period. The explanation is detailed, guiding viewers through each step of the process.
Takeaways
- 🌡️ The temperature over a day can be modeled with a sinusoidal function.
- 📈 Given a high temperature of 96 degrees and a low of 64 degrees, the midline of the sinusoidal function is calculated to be 80 degrees.
- ⏰ The low temperature of 64 degrees occurs at 4 A.M., which helps determine the phase shift in the sinusoidal model.
- 🔁 A period of 24 hours is established for the sinusoidal function, representing the 24-hour cycle of a day.
- 📊 The function must contain the points (4,64), (28,64), and (16,96) based on the given temperature data.
- 📐 The sinusoidal graph is sketched with the midline at y = 80 and reflects a transformation of the basic cosine function.
- 🔄 The graph is recognized as a reflection across the x-axis, with changes in amplitude, period, and horizontal and vertical shifts.
- 📉 The amplitude 'a' is determined to be -16, reflecting the graph's transformation and the difference between the high and midline temperatures.
- 🕒 The period 'b' is calculated as π/12, ensuring the function's period matches the 24-hour cycle.
- 🔄 The phase shift 'd' is identified as +4, indicating the graph's horizontal shift to the right.
- 📈 The vertical shift 'c' is +80, aligning the graph's midline with the temperature's average value.
Q & A
What type of function is used to model the outside temperature over a day?
-A sinusoidal function is used to model the outside temperature over a day.
What are the high and low temperatures mentioned in the script?
-The high temperature for the day is 96 degrees, and the low temperature is 64 degrees.
At what time does the low temperature of 64 degrees occur?
-The low temperature of 64 degrees occurs at 4 A.M.
What is the role of the midline in the sinusoidal function model?
-The midline of the sinusoidal function represents the average of the high and low temperatures, which is 80 degrees in this case.
How is the amplitude of the sinusoidal function determined?
-The amplitude is determined by the distance from the midline to the maximum or minimum temperature, which is 16 degrees in this case.
What is the period of the sinusoidal function representing the temperature over a day?
-The period of the sinusoidal function is 24 hours, representing the full day.
What points must the sinusoidal function pass through based on the given information?
-The sinusoidal function must pass through the points (4, 64), (28, 64), and (16, 96).
Why is the cosine function chosen over the sine function for this model?
-The cosine function is chosen because the given data points and the nature of the temperature changes over the day suggest a transformation of the basic cosine function.
How does the reflection across the x-axis affect the value of 'a' in the sinusoidal function?
-The reflection across the x-axis means that 'a' is negative, so 'a' is -16 in this model.
What is the value of 'b' that makes the period of the function 24 hours?
-The value of 'b' is π/12, which makes the period of the function 24 hours.
What are the values of 'd' and 'c' in the sinusoidal function, and what do they represent?
-'d' is +4, representing a rightward shift of the graph by 4 units, and 'c' is +80, representing an upward shift of the graph by 80 units.
What is the final equation of the sinusoidal function in terms of 'D(T)'?
-The final equation of the sinusoidal function in terms of 'D(T)' is D(T) = -16 * COSINE(π/12 * (T - 4)) + 80.
Outlines
🌡️ Modeling Daily Temperature Variation
This paragraph introduces the concept of modeling daily temperature changes using a sinusoidal function. Given the high temperature of 96 degrees and a low of 64 degrees at 4 A.M., the task is to find an equation for the temperature D in terms of the time T since midnight. The midline is calculated as the average of the high and low temperatures, resulting in 80 degrees. The function's period is determined to be 24 hours, and key points are identified, including (4, 64), (28, 64), and (16, 96). A sinusoidal graph is sketched, and it's recognized as a transformation of the cosine function, reflected across the x-axis with adjusted amplitude, period, and phase shift.
📉 Determining the Equation of the Sinusoidal Function
The second paragraph focuses on determining the specific values for the sinusoidal function that models the temperature. The amplitude 'A' is found to be -16, reflecting the graph across the x-axis. The period 'B' is calculated to be π/12, which corresponds to a 24-hour cycle. The phase shift 'D' is identified as +4, indicating a rightward shift of the graph. The vertical shift 'C' is determined to be +80, reflecting the midline of the sinusoidal function. The final equation for the temperature D(T) is given as D(T) = -16 * cos(π/12 * (T - 4)) + 80, providing a model for the temperature over a 24-hour period.
Mindmap
Keywords
💡Sinusoidal Function
💡Amplitude
💡Midline
💡Period
💡Phase Shift
💡Cosine Function
💡Reflection Across the X-axis
💡Horizontal Shift
💡Vertical Shift
💡Equation of a Function
Highlights
Modeling the outside temperature over a day using a sinusoidal function.
Given high temperature of 96 degrees and low temperature of 64 degrees.
Low temperature occurs at 4 A.M., with T representing hours since midnight.
Finding the midline of the sinusoidal function by averaging high and low temperatures.
The midline is determined to be a horizontal line at y = 80.
Using the points (4,64) and (28,64) to establish the period of the function as 24 hours.
Identifying the point (16,96) where the high temperature occurs.
Plotting the three key points on the coordinate plane.
Recognizing the graph as a transformation of the basic cosine function.
The graph is reflected across the x-axis, indicating a negative amplitude.
Determining the amplitude to be 16, reflected as -16 due to the graph's orientation.
Calculating the period of the function to be 24 hours, leading to B = π/12.
Shifting the graph right by four units, indicating D = +4.
Shifting the graph up by 80 units, resulting in C = +80.
Formulating the sinusoidal function D(T) = -16 * cos(π/12 * (T - 4)) + 80.
The sinusoidal function can model the temperature over a 24-hour period.
Transcripts
Browse More Related Video
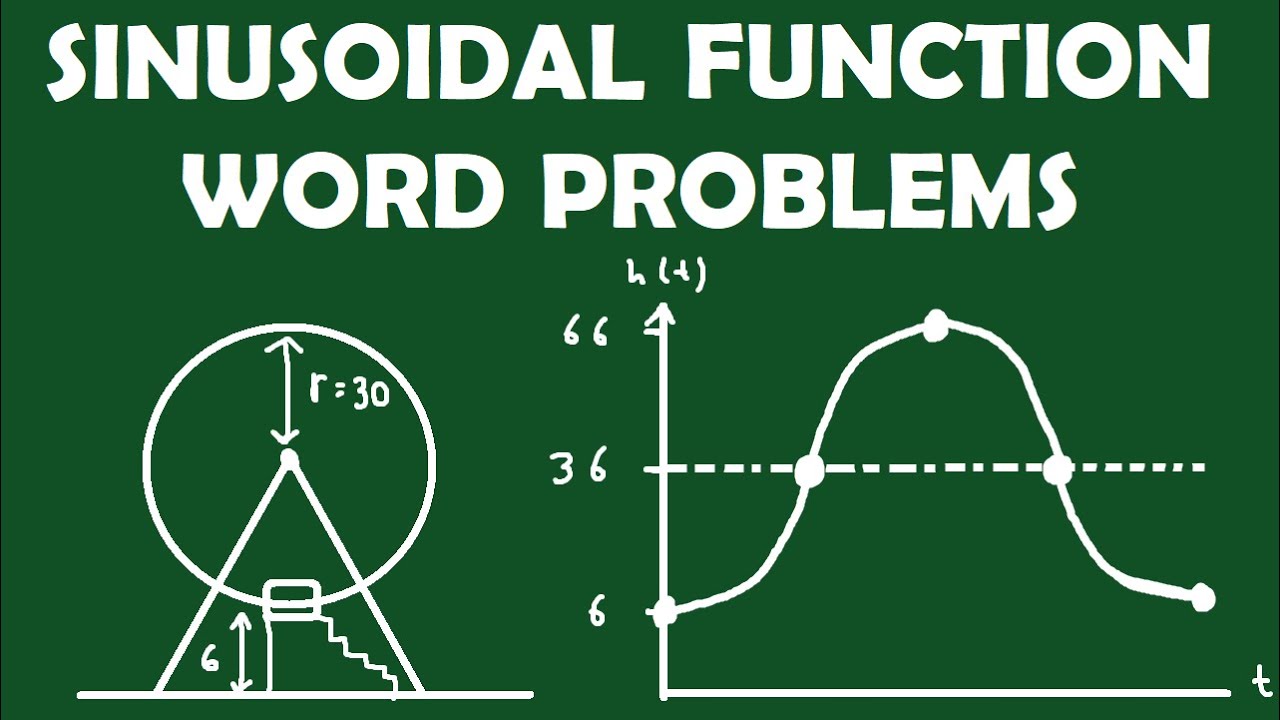
Sinusoidal Function Word Problems: Ferris Wheels and Temperature

2011 Calculus AB free response #2 (a & b) | AP Calculus AB | Khan Academy

2023 AP Calculus AB & BC FRQ #3
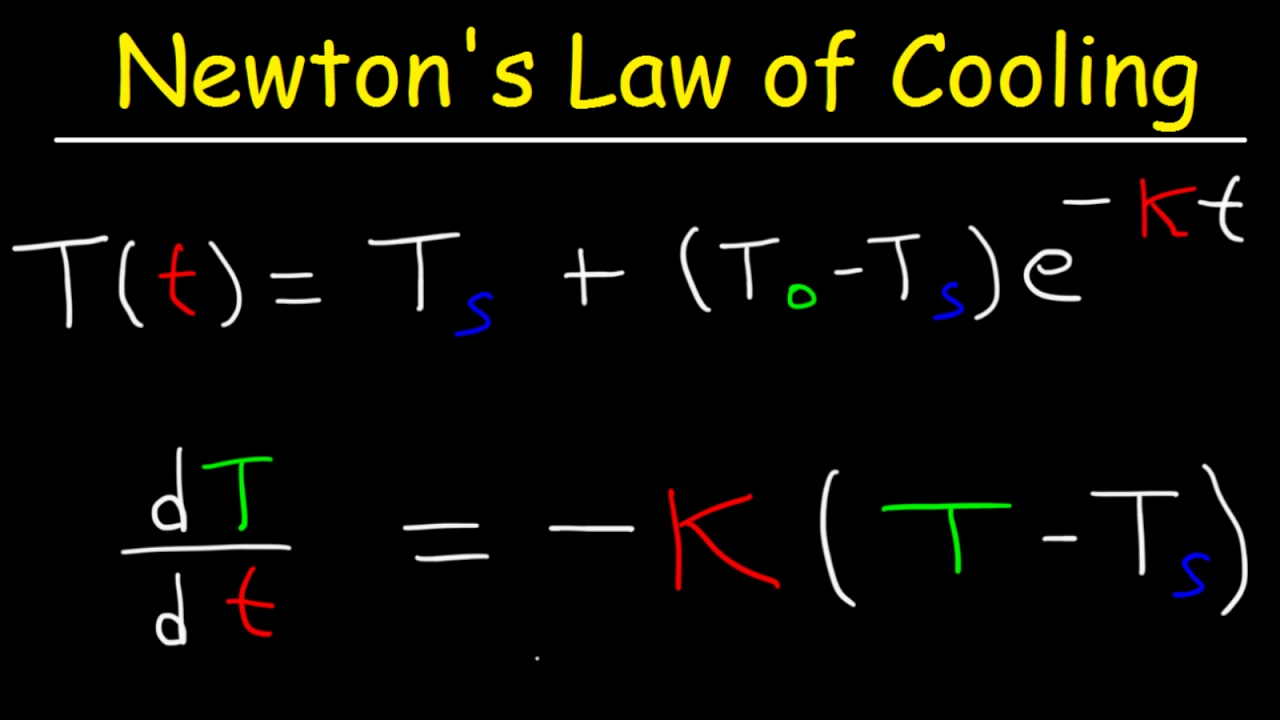
Newton's Law of Cooling Calculus, Example Problems, Differential Equations
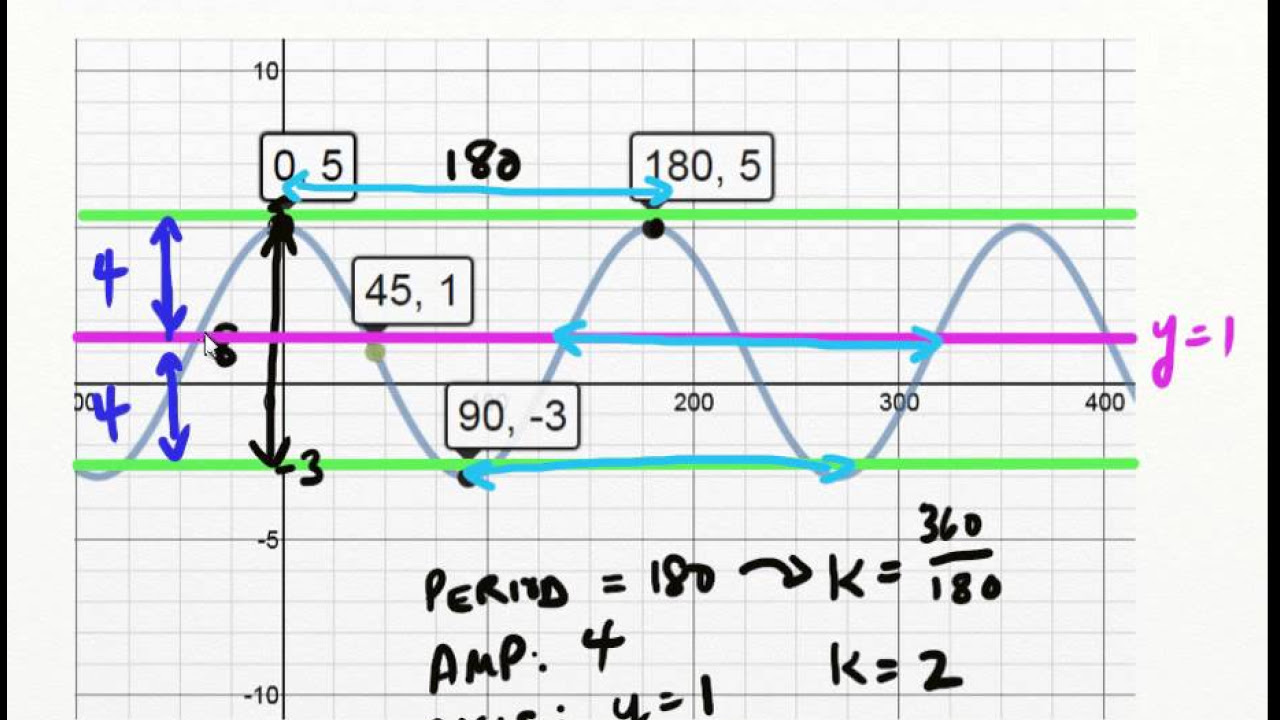
MCR3U UNIT 5 Writing Sine Cosine Equation Given Graph
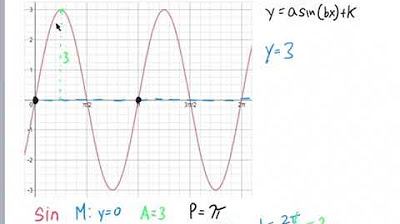
Writing Equations for Sinusoidal Functions
5.0 / 5 (0 votes)
Thanks for rating: