Sinusoidal Function Word Problems: Ferris Wheels and Temperature
TLDRThe video script discusses modeling the motion of a Ferris wheel and temperature variations throughout the year using sinusoidal functions. It begins by describing a 60-foot diameter Ferris wheel with a 100-second revolution time, guiding viewers through sketching the wheel and graphing the height of a rider as a sinusoidal function. The script then explains how to derive the equation for the rider's height over time, including amplitude, vertical reflection, and period adjustments. Following this, the script presents a second example involving modeling average daily temperatures with a sinusoidal function, given the hottest and coldest days of the year. It concludes by solving for the first spring day when the temperature reaches 20 degrees Celsius, demonstrating the practical application of sinusoidal functions in real-world scenarios.
Takeaways
- 🎡 The video discusses modeling the height of a rider on a Ferris wheel as a sinusoidal function.
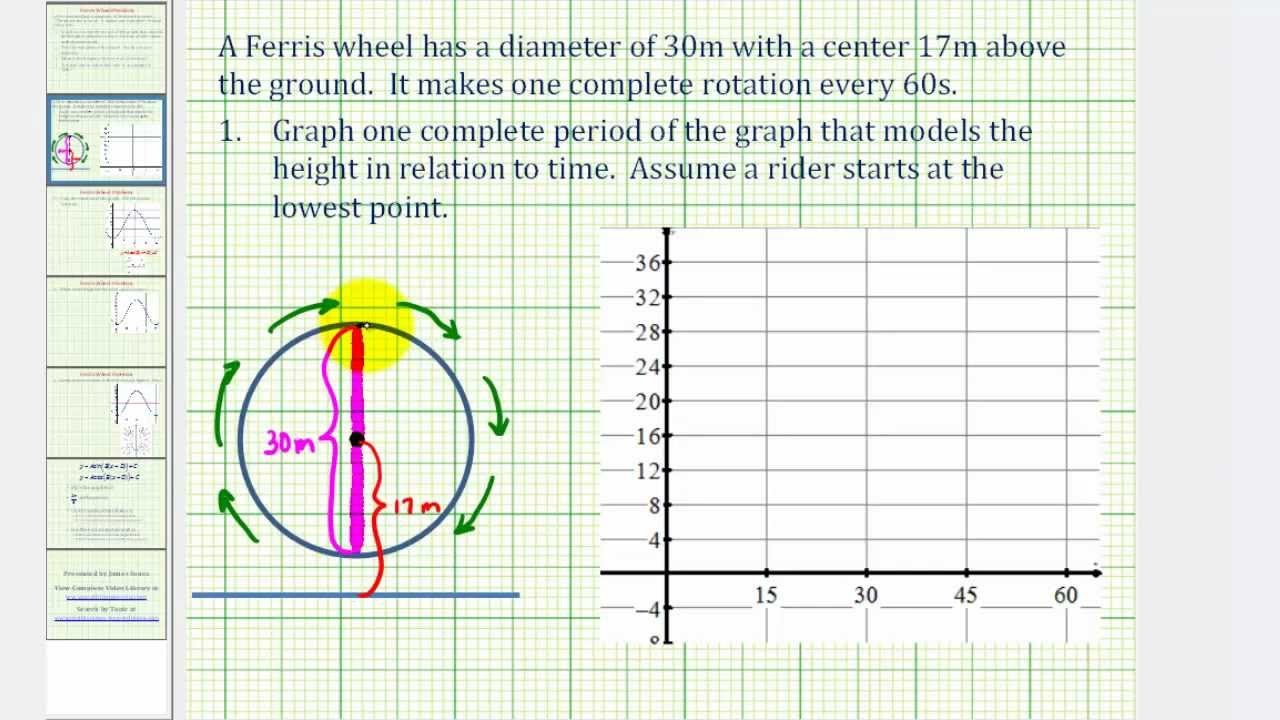
- 📏 The Ferris wheel has a diameter of 60 feet and riders climb 6 feet of stairs to board it at the lowest point.
- ⏱ The Ferris wheel completes one revolution every 100 seconds.
- 📊 The sinusoidal graph is created with time (t) on the x-axis and height (h) at time t on the y-axis.
- 📈 The graph starts at a minimum height of 6 feet, reaches a maximum of 66 feet, and has a midpoint at 36 feet.
- 🔁 The video explains the importance of aligning the graph's features with the physical characteristics of the Ferris wheel's motion.
- 🧩 The equation for the height of a rider on the Ferris wheel is derived as \( h(t) = -30\cos(3.6t) + 36 \).
- 🕒 The period of the Ferris wheel's motion is 100 seconds, which is reflected in the sinusoidal function.
- 🌡️ The second part of the video models the average temperature over a year using a sinusoidal function, with the hottest day at 29°C and the coldest at 14°C.
- ☀️ The temperature function is set up with days after June 7th on the x-axis and temperature on the y-axis, aiming to find the first spring day when temperature reaches 20°C.
Q & A
What is the diameter of the Ferris wheel described in the script?
-The diameter of the Ferris wheel is 60 feet.
How long does it take for the Ferris wheel to make one complete revolution?
-The Ferris wheel makes one complete revolution every 100 seconds.
How high are the stairs that one must climb to get on the Ferris wheel?
-One must climb six feet of stairs to get on the Ferris wheel at its lowest point.
What shape does the graph of a rider's height on the Ferris wheel resemble?
-The graph of a rider's height on the Ferris wheel resembles a sinusoidal function.
What is the maximum height a rider reaches on the Ferris wheel above the ground?
-The maximum height a rider reaches on the Ferris wheel above the ground is 66 feet (60 feet diameter plus the 6 feet of stairs).
What is the amplitude of the sinusoidal function modeling the rider's height on the Ferris wheel?
-The amplitude of the sinusoidal function is 30 feet, which is the radius of the Ferris wheel.
What is the period of the sinusoidal function representing one revolution of the Ferris wheel?
-The period of the sinusoidal function is 100 seconds, which is the time it takes for one complete revolution of the Ferris wheel.
At what time during the revolution does the rider reach the maximum height on the Ferris wheel?
-The rider reaches the maximum height at approximately 50 seconds into the revolution.
What is the height of the rider at 27 seconds into the revolution of the Ferris wheel?
-At 27 seconds into the revolution, the rider's height is approximately 39.76 feet.
How can you find the times when the rider's height is 40 feet on the Ferris wheel?
-To find the times when the rider's height is 40 feet, you would set the height (h) to 40 in the sinusoidal equation and solve for the time (t).
What is the average temperature on the hottest and coldest days of the year in the second example?
-The average temperature on the hottest day (June 7th) is 29 degrees Celsius, and on the coldest day, it is 14 degrees Celsius.
How many days after June 7th is the first spring day when the temperature reaches 20 degrees Celsius?
-The first spring day when the temperature reaches 20 degrees Celsius is approximately 262 days after June 7th.
What is the amplitude of the sinusoidal function modeling the temperature throughout the year?
-The amplitude of the sinusoidal function modeling the temperature is 7.5 degrees Celsius, which is half the difference between the hottest and coldest temperatures.
What value is used for 'k' in the sinusoidal function that models the temperature throughout the year?
-The value used for 'k' in the sinusoidal function is 72/73, which comes from dividing 360 degrees by the period of 365 days.
Outlines
🎡 Modeling the Height of a Rider on a Ferris Wheel
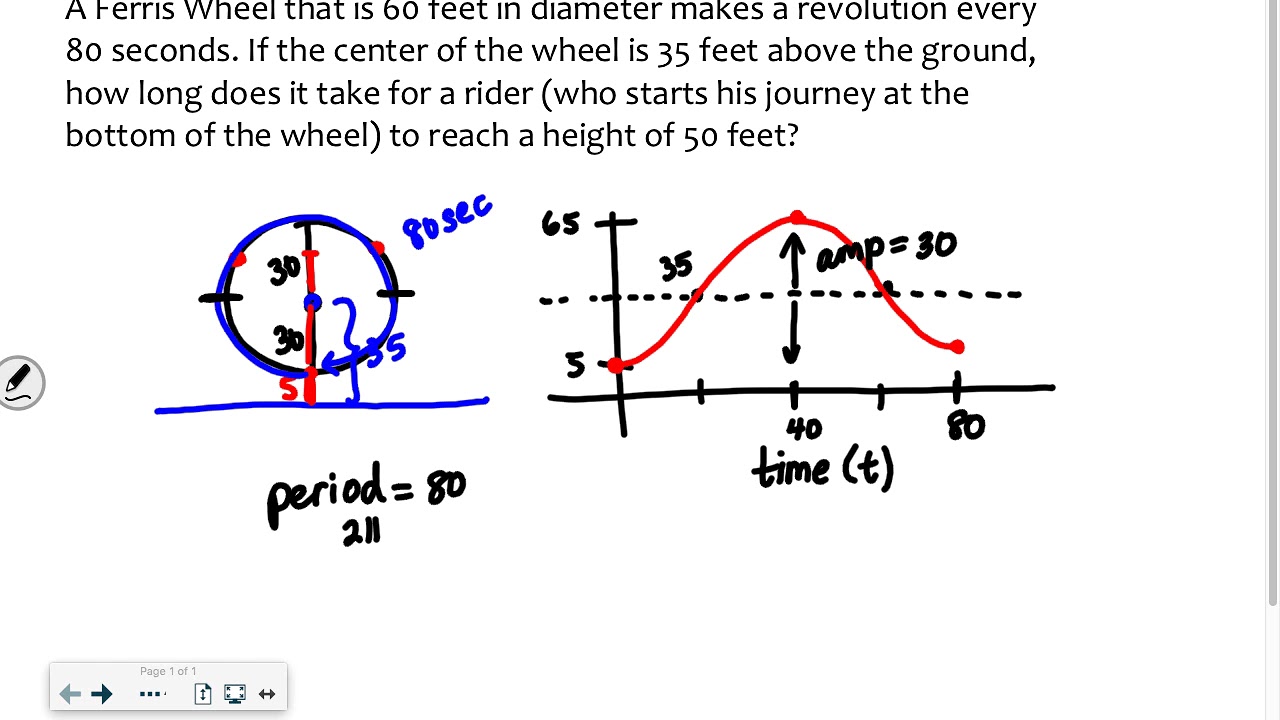
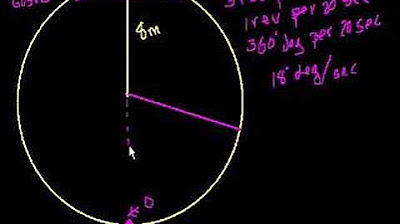
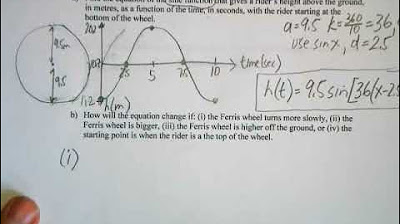
The paragraph describes the process of modeling the height of a rider on a Ferris wheel as a sinusoidal function. It explains the setup, where the Ferris wheel has a diameter of 60 feet and completes one revolution every 100 seconds. The rider climbs six feet of stairs to get on the wheel at its lowest point. The height of the rider is graphed over one revolution, starting at six feet and reaching a maximum of 66 feet (six feet above ground plus the 60 feet diameter). The midpoint height is 36 feet, halfway between the minimum and maximum heights. The graph illustrates the rider's height over time, showing the sinusoidal pattern of ascent and descent.
📊 Deriving the Sinusoidal Equation for the Ferris Wheel
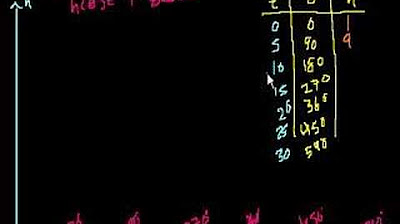
This paragraph focuses on deriving the sinusoidal equation for the height of the rider. It identifies that the graph resembles an upside-down cosine function. The amplitude is determined to be 30 feet, which is the radius of the Ferris wheel. The equation is adjusted for a vertical reflection, resulting in a negative amplitude. The midline of the function is at 36 feet, the average height. The period is 100 seconds, and the equation includes a coefficient to adjust for this period. The final equation, h(t) = -30cos(3.6t) + 36, is used to calculate specific heights at given times, demonstrating the relationship between time and height on the Ferris wheel.
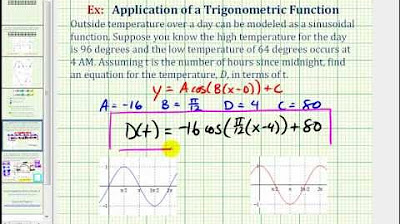
🌡️ Modeling Average Temperatures Throughout the Year
The paragraph discusses modeling average temperatures throughout the year using a sinusoidal function. It begins with the hottest day of the year, June 7th, at 29°C, and the coldest day, unknown but at 14°C. The midline temperature is calculated to be 21.5°C. The sinusoidal pattern is sketched, showing temperature fluctuations over 365 days. The amplitude is determined to be 7.5°C. The period of 365 days is used to derive the k value in the function. The equation t(d) = 7.5cos(72/73d) + 21.5 models the temperature over the year. The function is then used to determine the first spring day when the temperature reaches 20°C, resulting in 262 days after June 7th.
📅 Calculating Specific Temperature Days
This paragraph provides a detailed example of calculating specific temperature days using the derived sinusoidal function. The goal is to find the number of days after June 7th when the temperature first reaches 20°C in the spring. By setting the temperature equation to 20 and solving for d, the calculation yields an answer of 102.95 days initially. However, this represents the fall period, not the spring. To find the spring day, the distance from the end of the cycle is calculated, resulting in 262.05 days after June 7th, which is the correct spring day when the temperature reaches 20°C.
Mindmap
Keywords
💡Ferris Wheel
💡Sinusoidal Function
💡Amplitude
💡Period
💡Cosine Function
💡Graph
💡Temperature Modeling
💡Phase Shift
💡Midline
💡Trigonometric Functions
Highlights
A ferris wheel with a 60-foot diameter makes one revolution every 100 seconds.
Riders climb six feet of stairs to board the ferris wheel at its lowest point.
The height of a rider on the ferris wheel is modeled as a sinusoidal function.
The graph of the sinusoidal function represents one complete revolution of the ferris wheel.
Starting height of a rider is six feet above the ground.
Maximum height reached by a rider is 66 feet above the ground.
The axis of the graph aligns with the axle of the ferris wheel, representing the middle of the ride.
The period of the sinusoidal graph is 100 seconds, matching the ferris wheel's revolution time.
The amplitude of the sinusoidal function is 30 feet, equal to the radius of the ferris wheel.
The sinusoidal function is an upside-down cosine graph, indicating a vertical reflection.
The equation of the sinusoidal function is derived to model the rider's height over time.
The temperature on the hottest and coldest days of the year is used to model average temperature variations.
A sinusoidal function is also used to model the temperature changes throughout the year.
The axis of the temperature graph represents the average temperature, calculated as 21.5 degrees Celsius.
The amplitude of the temperature sinusoidal function is 7.5 degrees Celsius.
The period of the temperature function is 365 days, representing a full year.
The k value in the temperature function is calculated as 72/73 to adjust for the period of 365 days.
The first spring day when temperature reaches 20 degrees Celsius is calculated to be 262 days after June 7th.
Transcripts
5.0 / 5 (0 votes)
Thanks for rating: