Ex: Graph and Evaluate a Definite Integral on the TI84
TLDRThis tutorial demonstrates how to graph and evaluate definite integrals on a TI-84 calculator using two examples. The first example involves the function f(x) = x^3 - 4x + 5 over the interval [-2, 2], showing a non-negative function and calculating an area of 20 square units. The second example omits the constant, altering the function and window settings, revealing a function that crosses the x-axis. It explains how to interpret the definite integral as a signed area, resulting in a net area of zero, thus providing a visual understanding of definite integrals.
Takeaways
- 📚 The video provides a tutorial on graphing and evaluating definite integrals using a TI-84 graphing calculator.
- 🔍 The first example involves the function f(x) = x^3 - 4x + 5, which is graphed over the interval from -2 to 2.
- 📐 The calculator's window is adjusted to provide a clear view of the function over the specified interval.
- 🟢 The function is non-negative over the interval, indicating that the definite integral represents the area under the curve.
- 📈 The definite integral of the first example is found to be 20 square units, representing the area bounded by the function and the x-axis.
- 🔄 The second example modifies the integrand function by removing the constant term +5.
- 📉 The removal of the constant term causes the function to have parts below the x-axis, affecting the interpretation of the definite integral.
- 🎛 The window is adjusted again to accommodate the changes in the function's graph, especially the vertical scale.
- ⚖️ The definite integral of the second example evaluates to zero, indicating that the positive and negative areas under the curve cancel each other out.
- 📊 The video demonstrates the concept of signed area, where areas below the x-axis contribute negatively to the definite integral.
- 💡 Using the graphing calculator to visualize and evaluate definite integrals helps in understanding the process and the concept of integration.
Q & A
What is the purpose of the video?
-The purpose of the video is to demonstrate how to graph the region indicated by a definite integral and evaluate the definite integral on a TI-84 graphing calculator using two examples.
What is the first integrand function shown in the video?
-The first integrand function is f(x) = x^3 - 4x + 5.
How does the video guide you to adjust the window on the TI-84 calculator?
-The video instructs to press the 'Window' key and set the X min to -3, X max to 3, Y min to -2, and Y max to 10, with both x and y scales set to 1, to adjust the window for a better view of the function over the interval from -2 to 2.
What does the video indicate about the function's behavior over the interval from -2 to 2?
-The video indicates that the function is non-negative over the interval from -2 to 2, which means the value of the definite integral is equal to the area bounded by the function and the x-axis.
How does the video guide you to graph the area bounded by the function and the x-axis?
-The video instructs to press '2nd Trace' for the calculation menu and select option seven for integration, then enter the lower and upper limits of integration (-2 and 2, respectively) to graph the area.
What is the value of the definite integral for the first example given in the video?
-The value of the definite integral for the first example is positive 20, which means the area is exactly 20 square units.
What is the change in the integrand function for the second example compared to the first?
-In the second example, the constant plus five is removed from the integrand function, making the new function f(x) = x^3 - 4x.
Why does the video suggest adjusting the window again for the second example?
-The video suggests adjusting the window because the removal of the constant plus five shifts the function down, and part of the function is now below the x-axis over the interval from -2 to 2.
How does the video explain the concept of signed area in the context of definite integrals?
-The video explains that the definite integral can represent signed areas, where areas above the x-axis are positive and areas below the x-axis are negative. The sum of these signed areas gives the value of the definite integral.
What is the value of the definite integral for the second example, and what does it signify?
-The value of the definite integral for the second example is zero, signifying that the positive and negative areas (signed areas) are opposites of one another and cancel each other out.
What is the educational goal of demonstrating these examples on the TI-84 calculator?
-The educational goal is to help viewers better understand the concept of definite integrals by visually graphing the regions they represent and evaluating their values on a graphing calculator.
Outlines
📈 Graphing and Evaluating Definite Integrals on TI-84
This paragraph introduces a tutorial on how to graph the region indicated by a definite integral and evaluate the integral using a TI-84 graphing calculator. The first example involves integrating the function f(x) = x^3 - 4x + 5 from -2 to 2. The process includes entering the integrand, adjusting the window to view the function over the interval, and using the calculator's graphing and integration features. The function is non-negative over the interval, meaning the definite integral's value represents the area under the curve. The calculator is used to graph the area and evaluate the integral, resulting in an area of 20 square units. The second example modifies the integrand by removing the constant term, which changes the function's behavior and the window settings. The definite integral is evaluated again, but this time considering the signed area, resulting in a net value of zero due to the positive and negative areas cancelling each other out.
📚 Understanding Definite Integrals with Graphing Tools
The final paragraph wraps up the tutorial by emphasizing the educational value of using graphing tools to visualize and comprehend definite integrals. It suggests that graphing the region and evaluating the integral can enhance one's understanding of the concept. The author expresses hope that the tutorial was helpful to the viewer, indicating the end of the instructional content.
Mindmap
Keywords
💡Definite Integral
💡Graphing Calculator
💡Integrand Function
💡Window
💡Non-negative
💡Area Bounded by Function
💡Interval
💡Signed Area
💡Integration
💡Trace
Highlights
Introduction to graphing regions indicated by definite integrals and evaluating them on a TI-84 calculator.
Explanation of how to enter the integrand function f(x) = x^3 - 4x + 5 on the calculator.
Adjusting the window settings for a clear view of the function over the interval from -2 to 2.
Observation that the function is non-negative over the interval, indicating the integral value equals the area under the curve.
Changing the horizontal axis range to -3 to 3 and vertical axis to -2 to 10 for better visualization.
Using the graphing calculator to graph the area bounded by the function and evaluate the definite integral.
Accessing the integration feature on the calculator by pressing 2nd Trace and selecting option seven.
Entering the limits of integration (-2 and 2) to graph the region and evaluate the integral.
Visual representation of the definite integral's value as the area under the curve, which is 20 square units.
Transition to a second example with a modified integrand function without the constant +5.
Adjusting the window to account for the removal of the +5 constant from the function.
Observing the function's behavior over the interval, noting parts below the x-axis.
Evaluating the definite integral despite the function's varying sign over the interval.
Adjusting the y-axis to -6 to 6 for a comprehensive view of the function's graph.
Understanding the concept of signed area and how positive and negative areas can offset each other.
Calculating the definite integral from -2 to 2 and finding its value to be zero, illustrating the signed area concept.
The educational value of using a graphing tool to visualize and understand definite integrals.
Transcripts
Browse More Related Video

Area between a curve and the x-axis: negative area | AP Calculus AB | Khan Academy
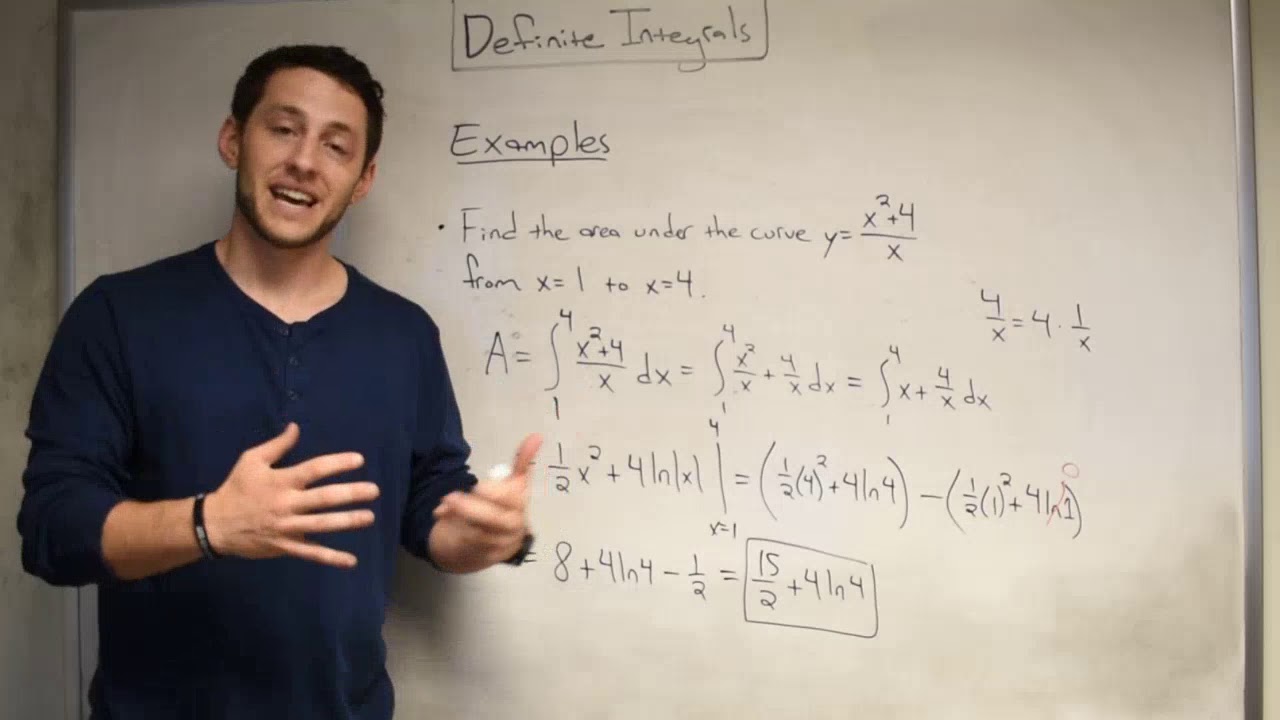
Definite Integrals!
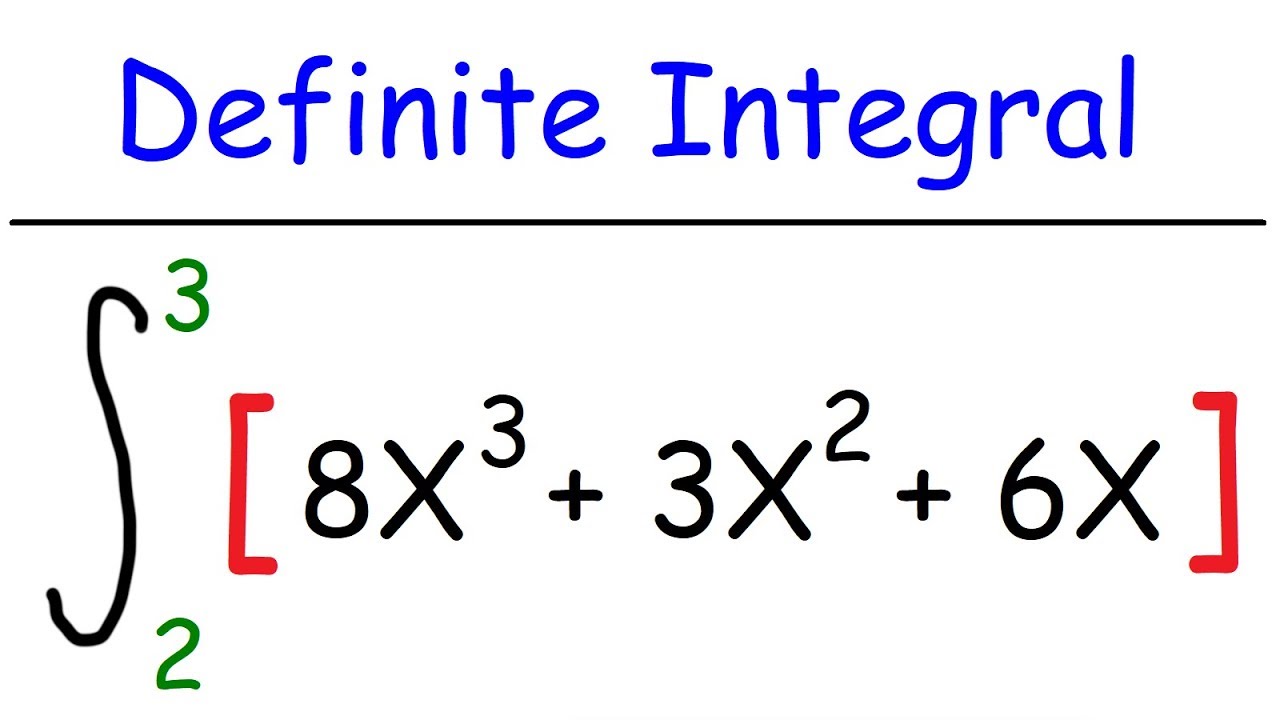
Calculus - Definite Integrals
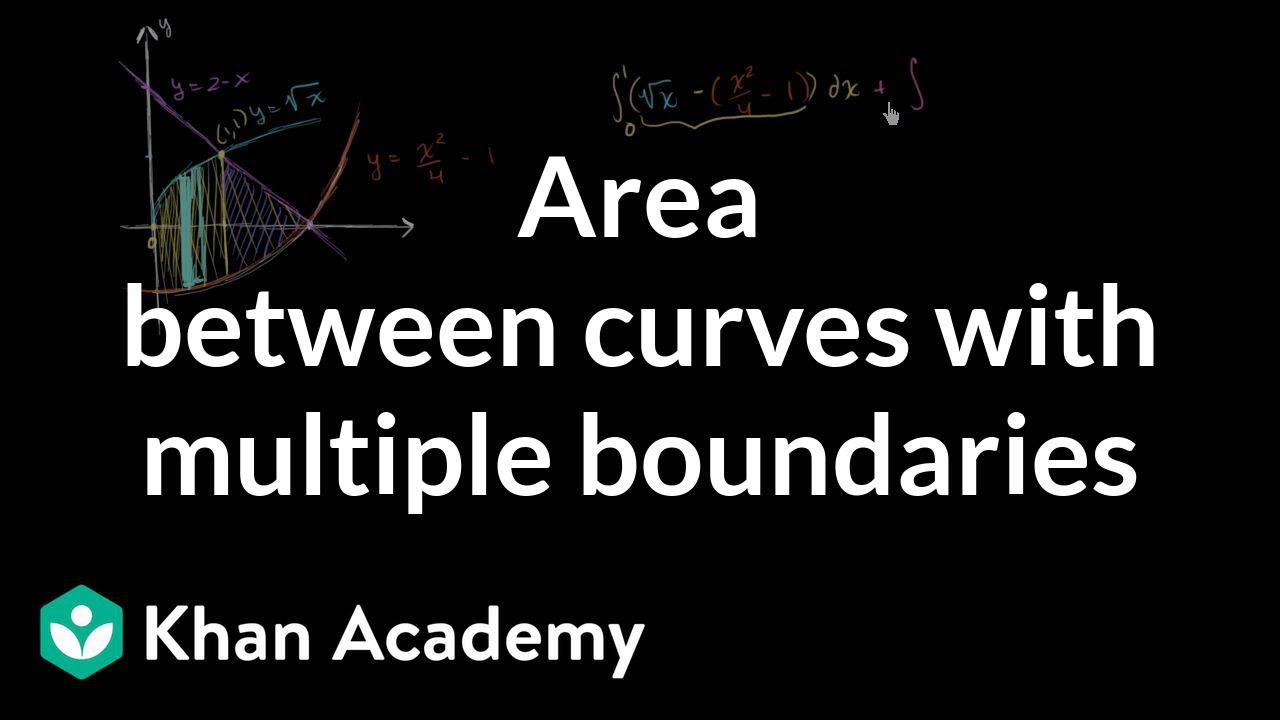
Area between curves with multiple boundaries

Area between a curve and the x-axis | AP Calculus AB | Khan Academy

Definite Integrals — Topic 88 of Machine Learning Foundations
5.0 / 5 (0 votes)
Thanks for rating: