calculator tricks for AP Calculus
TLDRIn this video, Vin shares a variety of calculator tricks tailored for AP Calculus students. He starts with resetting a calculator to fix any issues and moves on to typing in fractions using the alpha y equals enter method for accuracy. Vin then demonstrates how to adjust table settings for decimal values and graphing functions like exponentials, emphasizing the importance of window adjustments for clarity. He introduces the vars function shortcut for calculating average rates of change and finding function values without retyping. The video also covers calculating derivatives and integrals using the math 8 and math 9 functions, respectively, and shows how to visualize these on the graph or main screen. Vin explains the zoom box feature for focusing on specific graph areas and finding points of intersection. He concludes with tips on saving values found during calculations using the store button and alpha keys for easy recall, which is particularly useful for complex problems or when solving multiple related queries. This comprehensive guide is aimed at making calculator usage more efficient and less error-prone in AP Calculus.
Takeaways
- 🔄 **Reset Calculator**: Pressing second memory plus sign, then 7 for reset, can fix issues and restore normal operation.
- 📝 **Entering Fractions**: Use alpha y equals enter to input fractions accurately, ensuring parentheses are correctly applied.
- 📊 **Customizing the Table**: Adjust the table to include decimal values by pressing second window and switching to 'ask' for the independent variable.
- 🔢 **Decimal Display**: Switch from fractions to decimals in the y-values by changing the mode to decimal for a clearer representation.
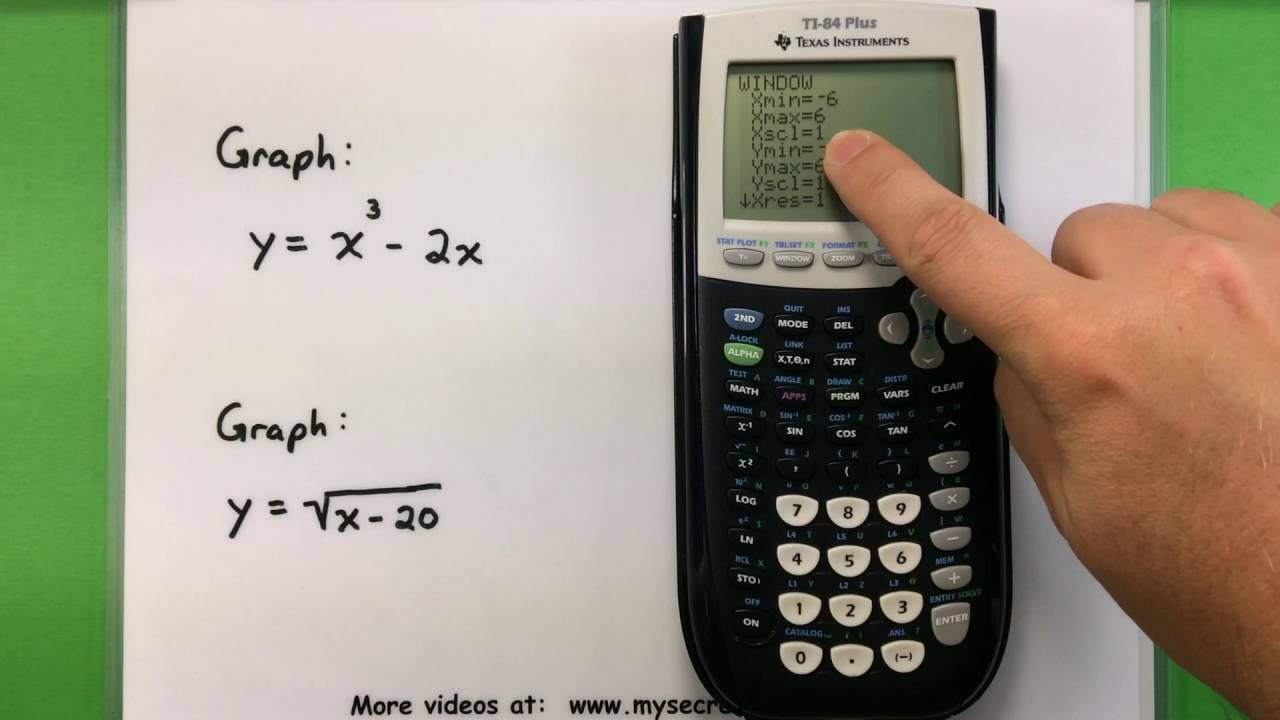
- 🏞️ **Window Settings**: Modify the graph's window settings to better visualize functions, such as adjusting y minimum and x minimum for exponential functions.
- 🔢 **Vars Function Shortcut**: Use the vars function to quickly input function values without retyping, especially useful for finding average rates of change.
- 📈 **Derivative Calculation**: Utilize the math 8 function to calculate the derivative of y1 with respect to X, and compare the original function graph with its derivative.
- ∫ **Integral Calculation**: Use math 9 to find the integral of a function from a specific range, and visualize the area under the curve with second trace number seven.
- 🔍 **Zoom Box Feature**: Employ the zoom box (Zoom 1) to focus on specific areas of the graph for detailed analysis.
- 📌 **Storing Values**: Save calculated points of intersection or other values using the store button and alpha keys for easy recall and use in further calculations.
- 🔗 **Finding Points of Intersection**: Use second trace number five to find and store points where two functions intersect, which can be useful for calculating areas between curves.
Q & A
How can you reset a calculator to fix potential issues?
-To reset a calculator, press the second memory key, which is next to the plus sign, then press seven for reset. Next, press one to clear all RAM and two to reset the calculator. This can help when the calculator is not functioning properly.
What is the advantage of using alpha y equals enter when typing in fractions on a calculator?
-Using alpha y equals enter is more forgiving and accurate when typing in fractions. It ensures that the calculator interprets the fraction correctly, with the correct parentheses over the top and bottom, which can prevent discrepancies in graph or table results.
How can you adjust the table settings on a calculator to include decimal values?
-To adjust the table settings for decimal values, press second window and switch the independent variable from Auto to Ask. This allows you to input non-integer values for X, such as decimals, pi, or pi over 2.
How do you change the calculator's mode from showing fractions to decimals in the Y values?
-To change the mode from fractions to decimals, press mode and then navigate to the answers submenu. Switch it from auto to decimal. This will display the Y values as decimals instead of fractions.
What is the purpose of adjusting the window settings on a calculator?
-Adjusting the window settings allows you to customize the view of the graph to better understand the function's behavior. For example, you can change the Y minimum and maximum to focus on specific parts of the graph and adjust the X minimum and maximum to avoid wasted space.
How can you find the average rate of change of a function between two points using the vars function shortcut?
-To find the average rate of change using the vars function shortcut, press vars, select the function from the right side, and input the function values at the two points by typing them in parentheses (e.g., F(5) - F(3)). Then divide the difference by the change in X values (e.g., 5 - 3).
How do you calculate the derivative of a function using a calculator?
-To calculate the derivative, press math 8 and select the derivative with respect to X of the function in the y1 spot. You can then use the vars function to input the function without retyping it. The calculator will display the derivative graph and allow you to find the derivative at specific points.
What is the process to calculate the integral of a function on a calculator?
-To calculate the integral, press math 9 and input the integral from a specific lower limit to an upper limit of the function in the y1 spot. Use the vars function to input the function without retyping it. The calculator will evaluate the integral and provide the result.
How can you use the trace function to find the area under a curve between two points?
-To find the area under a curve, use the trace function by pressing second trace and then number 7. Highlight the area between the curve and the X-axis from the lower to the upper limit by moving the cursor and pressing enter at each end of the interval. The calculator will display the area.
What is the zoom box feature and how is it used?
-The zoom box feature, accessed by pressing Zoom number one, allows you to zoom in on a specific area of the graph by drawing a rectangle around the desired section. After highlighting the area of interest, press enter to redraw the graph focusing only on the highlighted section.
How do you find the points of intersection between two curves using the trace function?
-To find points of intersection, press second trace number 5 and move the cursor close to the point where the curves intersect. Press enter before, at, and after the intersection point to capture the exact coordinates. These can be stored using the store button and assigned to a variable for later use.
How can you calculate the area between two curves using the calculator?
-To calculate the area between two curves, first identify the points of intersection (A and B). Then, set up the integral as the top function minus the bottom function (Y1 - Y2). Use math 9 to integrate from point A to point B, and the calculator will provide the area between the curves.
Outlines
🧮 Calculator Tricks for AP Calculus
In this paragraph, Vin introduces various calculator shortcuts and functions beneficial for AP Calculus. He begins with resetting the calculator to resolve any operational issues. Then, he demonstrates how to input fractions accurately using the alpha y= function to prevent common errors with parentheses. Vin also explains how to adjust the table settings for non-integer and decimal values, which is crucial for calculus problems. He further covers window settings adjustments for better graph representation and the use of the vars function for simplifying calculations, such as finding the average rate of change without manually retyping values. Lastly, he touches on calculating derivatives and integrals using the calculator's built-in functions.
📈 Graph and Table Manipulation
Vin continues with advanced techniques for graphing and table manipulation on the calculator. He shows how to adjust the window settings to better visualize exponential functions and how to use the zoom box feature for a closer look at specific areas of the graph. He also explains how to find points of intersection between two functions and save these values for later use. The paragraph covers the process of finding the area between curves by using the points of intersection and the store button to save values for convenience. This section is particularly useful for students who need to visualize and calculate areas under curves or between them.
🔢 Calculating Areas Between Curves
In the final paragraph, Vin focuses on calculating the area between two curves using the calculator. He illustrates how to subtract one function from another to find the area between their graphs and use the integral function to calculate this area from one point of intersection to another. He also demonstrates how to store the points of intersection as variables (A and B) to simplify the input process when calculating the area. The summary concludes with a mention of the calculator's ability to provide a clean and accurate decimal answer for the area, which can be rounded to the nearest thousandth if needed. Vin encourages students to share any additional tips or tricks in the comments section.
Mindmap
Keywords
💡Calculator Tricks
💡Reset Calculator
💡Fractions
💡Table Settings
💡Window Settings
💡Vars Function Shortcut
💡Derivative
💡Integral
💡Zoom Box Feature
💡Storing Values
💡Area Between Curves
Highlights
Resetting a calculator can fix issues by restoring it to its default state.
Using alpha y=x enter to input fractions ensures accuracy and correct parenthesis placement.
Adjusting the table settings allows for the input of non-integer and decimal values, which is crucial for calculus.
Switching the independent variable to 'ask' enables the investigation of values like pi or pi/2.
Changing the mode from auto to decimal in the answers menu provides decimal y-values for a more precise analysis.
Adjusting window settings can significantly improve the visualization of functions, such as exponential graphs.
The vars function shortcut simplifies the process of finding average rates of change without retyping values.
Calculators can calculate derivatives and integrals directly using specific functions, such as math 8 for derivatives.
The Zoom 6 function allows for a clearer view of the derivative graph in comparison to the original function.
Turning off a graph can be done by pressing enter on the equal sign, making the graph invisible without deleting it.
Finding the derivative at a specific point can be done by switching the calculator to 'ask' and inputting the desired x-value.
The integral of a function can be calculated and evaluated using the math 9 function.
Graphically finding the area under a curve can be done using the second Trace number seven feature.
The Zoom box feature (Zoom number one) allows for focusing on a specific area of the graph for detailed analysis.
Finding points of intersection can be done carefully using the second Trace number five and storing them for future use.
Storing values using the store button and associating them with letters (like Alpha math for 'a') saves time when reusing these values.
Calculating the area between two curves involves finding the points of intersection and using the math 9 function with the top function minus the bottom function.
The calculator provides a clean and accurate answer for the area between curves, which can be rounded to the nearest thousandth place if needed.
Transcripts
Browse More Related Video
AP Calculus AB 2012 Multiple Choice (no calculator) - Questions 1-28

AP Calculus AB 2003 Multiple Choice (no calculator) - Questions 1-28

TI89: How to Integrate Using Your Calculator

How to get a 5 on the AP Calculus AB or BC exam!

TI84 Graph a line and find table of values
Basic Math - Graphing with a Ti-83 or Ti-84 Calculator
5.0 / 5 (0 votes)
Thanks for rating: