Graphing Rational Functions With Vertical, Horizontal & Slant Asymptotes, Holes, Domain & Range
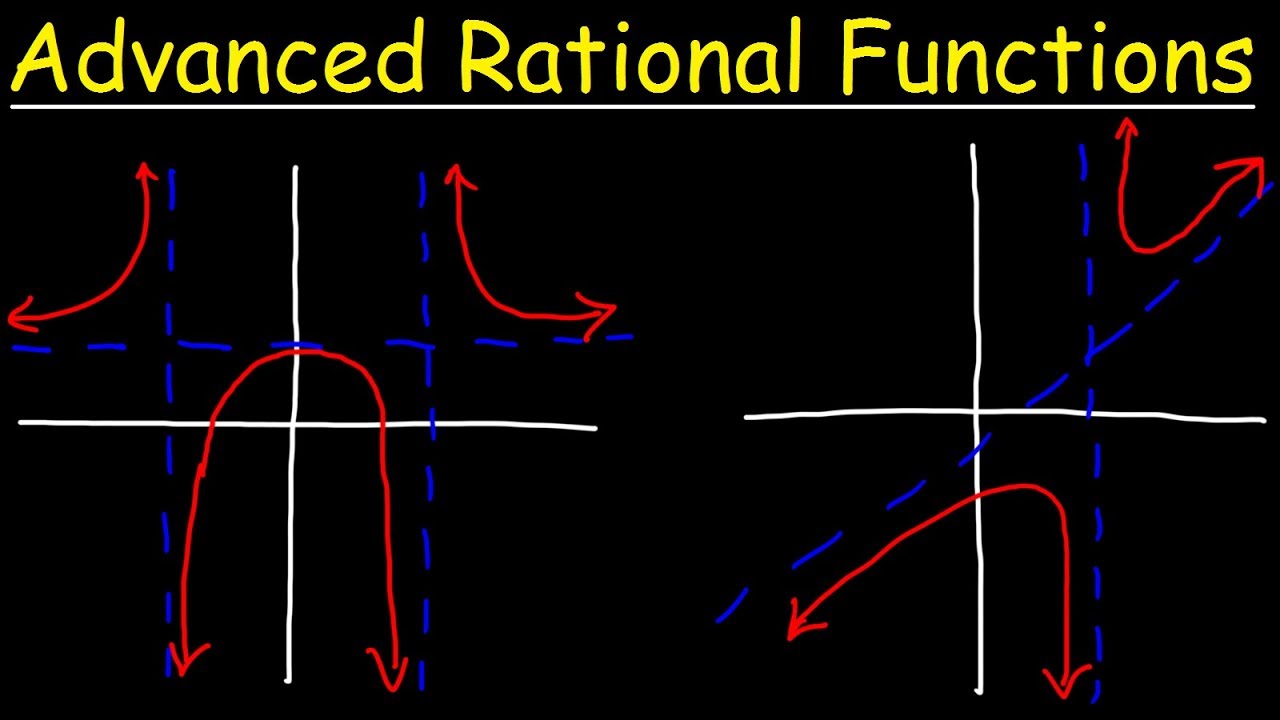
TLDRThis educational video script offers an in-depth exploration of graphing rational functions, focusing on identifying key features such as asymptotes, holes, domain, and range. It explains how to determine vertical and horizontal asymptotes, and introduces the concept of slant or oblique asymptotes when applicable. The script guides viewers through the process of graphing various rational functions, including those with shifted asymptotes and holes, and provides methods for finding domains and ranges. It also covers how to handle negative functions and those with squared terms, ensuring a comprehensive understanding of the topic.
Takeaways
- 📈 The video focuses on graphing rational functions, explaining how to identify and plot asymptotes, holes, and how to determine the domain and range of these functions.
- 👉 The parent function y = 1/x has a vertical asymptote at x = 0 and a horizontal asymptote at y = 0, with the graph existing in the upper right and lower left corners.
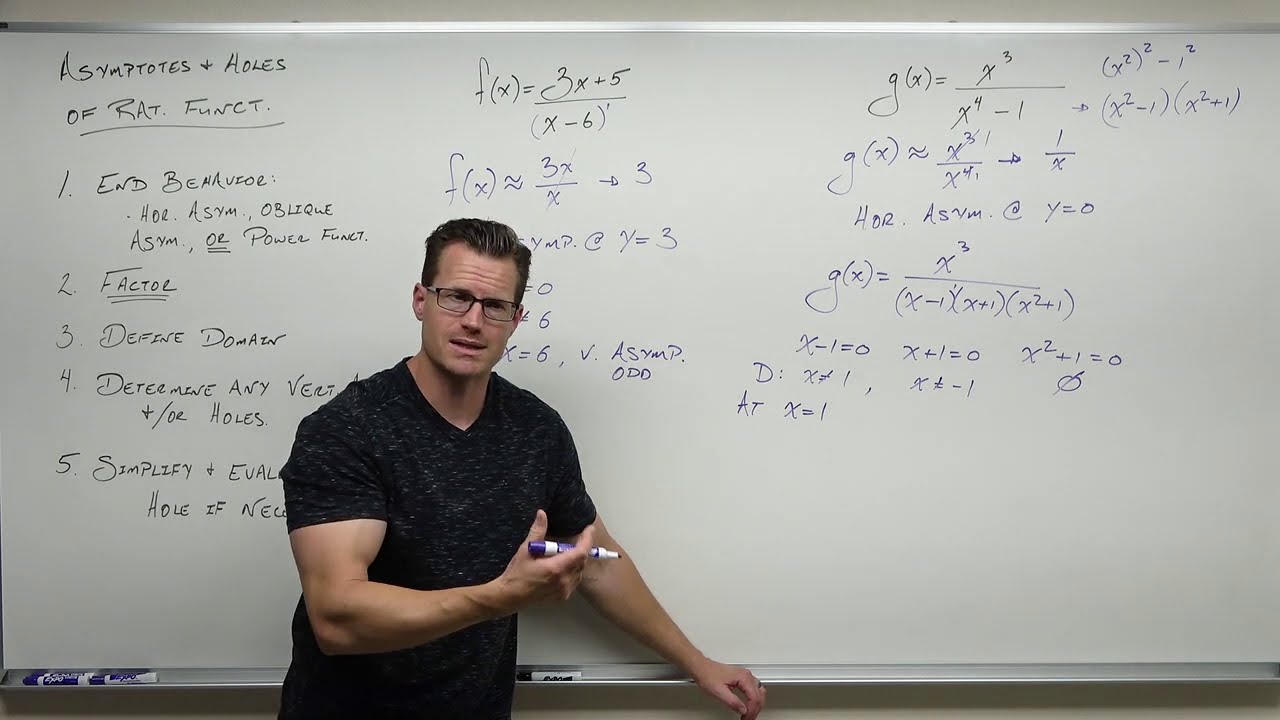
- 📐 To find the vertical asymptote, set the denominator of the rational function equal to zero.
- 📉 For functions where the degree of the denominator is higher than the numerator, the horizontal asymptote is y = 0.
- ∞📉 The domain of a rational function is all possible x values excluding x values that cause vertical asymptotes or holes.
- 🔍 The range of a rational function is determined by removing the y value of the horizontal asymptote and any holes from the possible y values.
- 🔢 When graphing y = 1/x^2, the lowest y value is not negative infinity but zero, and the highest is positive infinity, resulting in a range from zero to infinity.
- 🔄 The graph of y = 1/(x - 1) is shifted one unit to the right compared to y = 1/x, with a vertical asymptote at x = 1.
- 📊 For functions with the same degree of numerator and denominator, the horizontal asymptote is determined by dividing the leading coefficients.
- 📈 If the degree of the numerator exceeds the denominator by one, a slant or oblique asymptote is present, which can be found using long division.
- 🤔 The video also covers how to handle negative functions, which reflect over the x-axis, and how to find x-intercepts and y-intercepts for more accurate graphing.
Q & A
What are the main topics covered in the video on graphing rational functions?
-The video covers how to graph rational functions, including identifying vertical, horizontal, slant, and oblique asymptotes, defining holes, and determining the domain and range of the functions.
What is the vertical asymptote of the parent function y = 1/x?
-The vertical asymptote of the parent function y = 1/x is x = 0, which is on the y-axis.
What is the horizontal asymptote for a function where the degree of the denominator is higher than the degree of the numerator?
-For functions where the degree of the denominator is higher than the degree of the numerator, the horizontal asymptote is y = 0.
How is the graph of y = 1/x squared different from the graph of y = 1/x?
-The graph of y = 1/x squared is similar to y = 1/x but it is always positive or above the x-axis since squaring a number cannot result in a negative value.
What is the domain of the function y = 1/x squared?
-The domain of the function y = 1/x squared is all real numbers except x cannot equal zero, so it is from negative infinity to zero union zero to positive infinity.
How do you find the vertical asymptote for the function f(x) = 1/(x - 1)?
-The vertical asymptote for the function f(x) = 1/(x - 1) is found by setting the denominator equal to zero, which gives x = 1.
What is the horizontal asymptote for the function f(x) = 1/(x - 1)?
-The horizontal asymptote for the function f(x) = 1/(x - 1) is y = 0, as the degree of the denominator is greater than the degree of the numerator and there are no additional terms to shift the asymptote.
How does the presence of a negative sign in front of a function affect its graph?
-A negative sign in front of a function will reflect the graph over the x-axis, meaning if the original graph is above the x-axis, it will now be below, and vice versa.
What is the process to find the horizontal asymptote for functions where the degree of the numerator is the same as the degree of the denominator?
-For functions where the degree of the numerator is the same as the degree of the denominator, the horizontal asymptote is found by dividing the leading coefficient of the numerator by the leading coefficient of the denominator.
What is a slant or oblique asymptote and how do you find it?
-A slant or oblique asymptote occurs when the degree of the numerator exceeds that of the denominator by one. To find it, you perform long division of the function and the resulting quotient is the equation of the slant asymptote.
Outlines
📈 Introduction to Graphing Rational Functions
This paragraph introduces the topic of graphing rational functions, focusing on identifying asymptotes—both horizontal and vertical—as well as slant and oblique ones. It also discusses how to determine the domain and range of a function. The parent function, y = 1/x, serves as an example to illustrate these concepts. The domain is explained as all possible x-values excluding vertical asymptotes and holes, while the range is all possible y-values excluding horizontal asymptotes and holes. The function's graph shows behavior in the upper right and lower left corners, with specific asymptotes and domain and range definitions provided.
🔍 Analyzing Asymptotes and Graphing 1/x^2
The paragraph delves into the details of graphing the function y = 1/x^2, starting with finding its vertical asymptote at x = 0 by setting the denominator to zero. It explains that the horizontal asymptote remains y = 0 due to the 'bottom-heavy' nature of the function. The graph's behavior is described, emphasizing the positive values since squaring a number cannot yield a negative result. The domain and range are discussed, noting that the domain remains the same as the parent function, but the range starts from y = 0 to positive infinity, reflecting the function's behavior above the x-axis.
📚 Shifting Asymptotes: Graphing 1/(x-1)
This section discusses how to graph the function f(x) = 1/(x-1) by identifying its vertical asymptote at x = 1, achieved by setting the denominator to zero. The horizontal asymptote is still y = 0, as the function remains bottom-heavy. The paragraph provides a step-by-step guide to sketching the graph, including choosing strategic points to illustrate the function's behavior near the vertical asymptote and on both sides of it. It also includes a brief on how to find points for an accurate graph and how the left side of the graph mirrors the right side, with specific x-values chosen to demonstrate this.
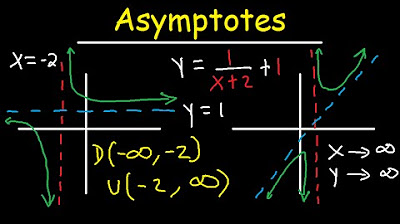
📉 Graphing and Domain/Range of 1/(x+2) - 3
The paragraph explains the process of graphing the function y = 1/(x+2) - 3, starting with finding the vertical asymptote at x = -2 and the horizontal asymptote at y = -3. It describes how to plot these asymptotes and suggests plugging in points to sketch the graph accurately. The function's graph is characterized by its behavior around the asymptotes, and specific points are calculated to illustrate this. The domain and range are then discussed, with the domain excluding the vertical asymptote and the range reflecting the function's limits between negative infinity and the horizontal asymptote.
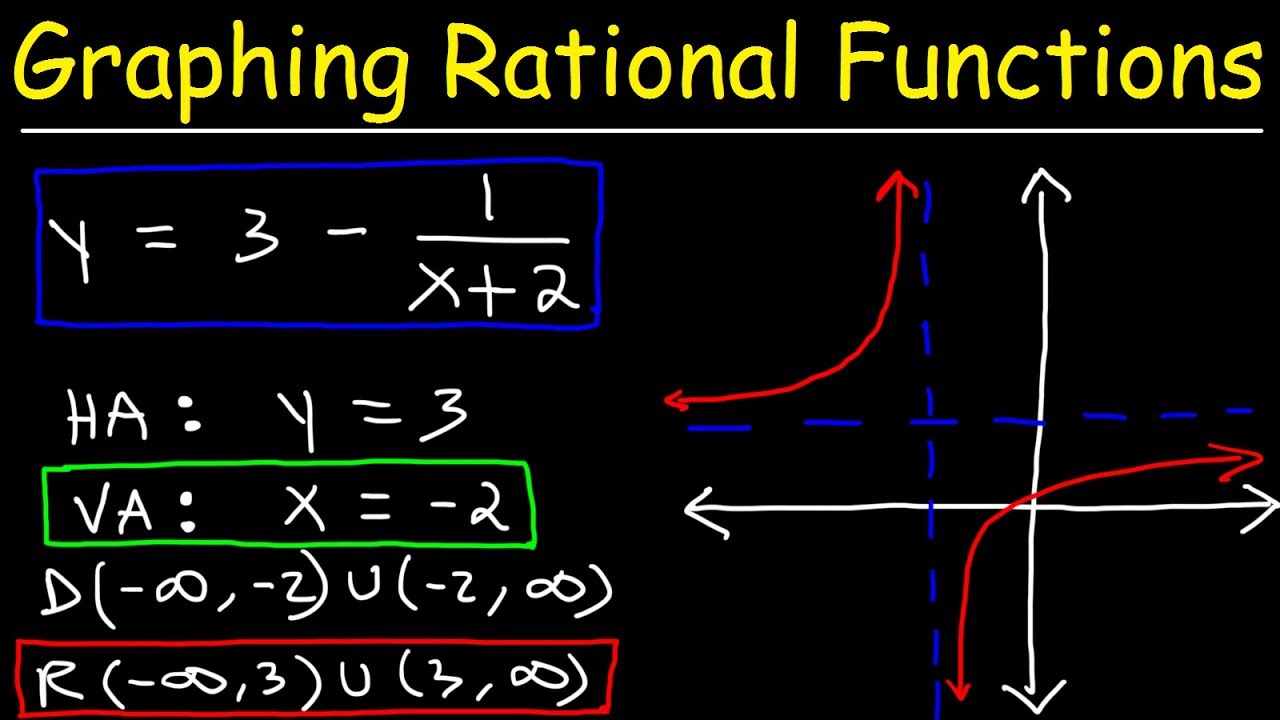
🔄 Effects of Negative Signs on Asymptotes
This section examines the impact of adding a negative sign to rational functions, demonstrating how it reflects the graph over the x-axis. It uses the function y = -1/(x+2) + 3 as an example to show how the vertical asymptote shifts left by two units and the horizontal asymptote is raised by three units. The paragraph also explains that the negative sign causes the graph to be below the new horizontal asymptote of y = 3 and provides a rough sketch of the graph based on points calculated on either side of the vertical asymptote.
📘 Understanding Horizontal Asymptotes in Different Functions
The paragraph explores how to determine horizontal asymptotes for various rational functions, depending on whether the function is bottom-heavy, has the same degree for numerator and denominator, or has a numerator degree exceeding the denominator's. It explains the rules for calculating horizontal asymptotes in each case, including the effects of constants outside the function. The section also provides examples of finding horizontal asymptotes for given functions and touches on the concept of slant asymptotes for functions where the numerator's degree exceeds the denominator's by one.
🤔 Long Division and Slant Asymptotes
This section introduces the concept of slant or oblique asymptotes for rational functions where the degree of the numerator exceeds that of the denominator by one. It demonstrates the process of finding a slant asymptote through long division using the example y = 2(x-2)/(x-3). The paragraph explains how to perform the division to obtain the equation of the slant asymptote and discusses the vertical and horizontal asymptotes of the function, including how to find x-intercepts and the behavior of the graph near these asymptotes.
📊 Factoring and Graphing Rational Functions with Slant Asymptotes
The paragraph discusses the process of graphing rational functions with slant asymptotes, starting with factoring the numerator and denominator to identify vertical asymptotes and holes. It uses the function f(x) = (3x^2 + 9x - 12)/(x^2 + x - 2 - 4) as an example, showing how to simplify the expression by factoring and finding the GCF. The horizontal asymptote is calculated from the leading coefficients, and the vertical asymptote is identified. The paragraph also describes how to find x-intercepts and y-intercepts and provides a step-by-step guide to graphing the function, including the shape of the graph around the asymptotes and holes.
📈 Graphing Functions with Slant Asymptotes Using Long Division
This section focuses on graphing functions with slant asymptotes by using long division to find the equation of the asymptote. The example function 2x^2 + 6x - 8/x - 2 is used to demonstrate this process. The paragraph explains how to perform long division to obtain the slant asymptote y = 2x + 10 and how to factor the numerator to find vertical asymptotes and x-intercepts. It also discusses the importance of knowing the highest and lowest points of the graph, which can be found using a graphing calculator, and how to plot these points to sketch the function's graph.
🌟 Conclusion on Graphing Rational Functions
The final paragraph wraps up the discussion on graphing rational functions, summarizing the key points covered in the video. It emphasizes the importance of understanding how to identify horizontal, vertical, and slant asymptotes, as well as locating holes in the graph. The paragraph also highlights the process of determining the domain and range of these functions, mentioning the use of graphing calculators for complex graphs. The video concludes with a reminder of the steps involved in graphing rational functions and a thank you note to the viewers.
Mindmap
Keywords
💡Rational Functions
💡Asymptotes
💡Vertical Asymptote
💡Horizontal Asymptote
💡Slant Asymptote
💡Domain
💡Range
💡Holes
💡Graphing
💡Long Division
💡X-intercept
💡Y-intercept
Highlights
The video focuses on graphing rational functions, including identifying asymptotes and defining domain and range.
The parent function Y=1/X has a vertical asymptote at x=0 and a horizontal asymptote at y=0.
Domain of Y=1/X is from negative infinity to zero union zero to infinity, excluding x=0.
Range of Y=1/X is from negative infinity to zero union zero to infinity, excluding y=0.
For Y=1/x^2, the graph is similar to Y=1/X but only positive values are taken, resulting in a different range.
Graphing Y=1/(x-1) involves shifting the graph one unit to the right and maintaining a horizontal asymptote at y=0.
To graph Y=1/(x-1), find vertical and horizontal asymptotes and use them to sketch the function.
The video demonstrates how to find points on the graph of Y=1/(x-1) to enhance accuracy.
The domain and range of Y=1/(x-1) are explained with respect to the function's vertical asymptote.
For Y=1/(x+2)-3, the horizontal asymptote is shifted down by 3 units, resulting in y=-3.
The video shows how to graph Y=1/(x+2)-3 by plotting asymptotes and estimating points.
The domain and range of Y=1/(x+2)-3 are discussed, considering the function's asymptotes.
The impact of a negative sign on the graph of a function, causing reflection over the x-axis, is explained.
Different methods for finding horizontal asymptotes are presented, based on the degrees of the numerator and denominator.
The video illustrates how to determine if a function has a slant asymptote by comparing the degrees of the numerator and denominator.
An example of graphing a function with a slant asymptote, Y=2(x-2)/(x-3), is provided, including finding the vertical asymptote and x-intercepts.
The domain and range of functions with slant asymptotes are discussed, with an example provided.
The video concludes with a comprehensive example of graphing a rational function with a slant asymptote, including finding the domain and range.
Transcripts
Browse More Related Video
Graphing Advanced Rational Functions With Asymptotes and Holes Using Transformations
Horizontal and Vertical Asymptotes - Slant / Oblique - Holes - Rational Function - Domain & Range
Finding Asymptotes and Holes of Rational Functions (Precalculus - College Algebra 43)

Graphing Rational Functions with Transformations (Precalculus - College Algebra 39)
Graphing Rational Functions Using Transformations With Vertical and Horizontal Asymptotes

Graphing Rational Functions (Precalculus - College Algebra 44)
5.0 / 5 (0 votes)
Thanks for rating: