AP Physics Workbook 10.B Relationship Between Wave Speed, Frequency, and Wavelength
TLDRThe video script outlines an experiment to determine the velocity of a standing wave on a string using an oscillator and a pulley system. It explains the setup, procedure, and data analysis, emphasizing the relationship between wave speed, frequency, and wavelength. The script details how to measure distances, increase frequency to form standing wave patterns, and record frequencies for different harmonics. It further clarifies the calculation of wavelength for each harmonic and how to use the velocity formula to find the wave speed. The explanation includes a graphical approach to determine the velocity and the importance of linearization for the best fit line equation.
Takeaways
- 📚 The experiment involves understanding the relationship between wave speed, frequency, and wavelength in a mechanical wave scenario.
- 🧪 The setup includes a string attached to an oscillator and a hanging mass, with a pulley system in between.
- 🎛️ The procedure starts by measuring the distance (l) from the oscillator to the start of the pulley and then increasing the oscillator's frequency to form standing wave patterns.
- 🌐 The first harmonic (fundamental wavelength) is observed when n=1, with the wave pattern centered at one antinode.
- 🔄 As the frequency increases, subsequent harmonics (n=2, 3, 4, etc.) are observed, each with an additional node and a specific relationship to the wavelength.
- 📈 The wavelength (λ) can be determined using the formula λ = 2l for the first harmonic, and variations of this formula for higher harmonics.
- 🚀 The velocity (v) of the wave on the string is calculated using the formula v = λ × frequency.
- 📊 Data analysis involves graphing the wavelength (λ) against frequency (f) to find the velocity, using the area under the graph as a representation of velocity.
- 📈 Linearizing the data can be done by graphing the reciprocal of the wavelength (1/λ) against frequency (f) to obtain a straight line for the line of best fit.
- 🧠 Memorizing the fundamental wavelength and harmonic relationships is crucial for analyzing the data and determining the wave velocity.
- 🎥 The script also discusses the importance of accurately counting the number of waves in a given time to determine frequency.
Q & A
What is the main topic of the tutorial?
-The main topic of the tutorial is the relationship between wave speed, frequency, and wavelength in the context of mechanical waves and sound, specifically focusing on standing waves on a string.
How is the experiment set up?
-The experiment is set up by attaching one end of a string to an oscillator and the other end to a hanging mass using a pulley. The oscillator is used to shake the string at various frequencies, allowing the formation of standing wave patterns to be observed.
What is the procedure for conducting the experiment?
-The procedure involves measuring the distance from the oscillator to the start of the pulley, then increasing the frequency on the oscillator until standing wave patterns form on the string. The first harmonic (one antinode) is observed and its frequency (f1) is recorded. This process is repeated for higher harmonics (n=2, 3, 4), recording the frequencies (f2, f3, f4) as they are observed.
How can the velocity of the wave on the string be determined?
-The velocity of the wave on the string can be determined by using the formula velocity equals lambda (wavelength) times frequency. The wavelength can be inferred from the harmonic frequencies observed during the experiment.
What is the significance of the fundamental wavelength?
-The fundamental wavelength is the wavelength of the first harmonic when n equals to one. It is significant because it serves as the basis for calculating the wavelengths of higher harmonics and ultimately determining the wave velocity.
How are the wavelengths of higher harmonics related to the fundamental wavelength?
-The wavelengths of higher harmonics are related to the fundamental wavelength by specific ratios. For example, the second harmonic (one node) has a wavelength equal to the fundamental wavelength (lambda 2 = 2l), the third harmonic (two antinodes) has a wavelength equal to two-thirds of the fundamental wavelength (lambda 3 = 2/3 * l), and the fourth harmonic (four antinodes) has a wavelength equal to one-half of the fundamental wavelength (lambda 4 = 1/2 * l).
What is the method for analyzing the data to determine the wave velocity?
-The method for analyzing the data involves graphing the wavelength on one axis and the frequency on the other axis. The area under the graph, where the wavelength and frequency intersect, represents the velocity. Alternatively, the data can be linearized by plotting the reciprocal of the wavelength (1/lambda) against the frequency, and the slope of the line of best fit gives the velocity.
How does the area formula relate to the calculation of wave velocity?
-The area formula relates to the calculation of wave velocity in that velocity is equal to the product of wavelength (lambda) and frequency (f), which is analogous to the area calculation of length times width. By graphing the wavelengths and frequencies, the area under the curve at the point of intersection gives the velocity.
What is the purpose of linearizing the data in the analysis?
-The purpose of linearizing the data is to simplify the relationship between the variables and make it easier to determine the line of best fit. By taking the reciprocal of the wavelength (1/lambda) and plotting it against the frequency, the relationship becomes linear, allowing for a straightforward calculation of the slope, which represents the wave velocity.
How can the line of best fit be determined from the data?
-The line of best fit can be determined by plotting the reciprocal of the wavelength (1/lambda) on the x-axis and the frequency on the y-axis. The line that best fits these points, with the highest correlation, has a slope that equals the wave velocity. The equation of this line is y = mx + b, where m is the slope (velocity) and b is the y-intercept.
What is the significance of the frequency in the context of standing waves?
-The frequency in the context of standing waves refers to how many cycles of the wave occur in a given time period. It is significant because it is directly related to the wavelength and wave speed, and it is used to identify the harmonics of the standing wave patterns observed in the experiment.
Outlines
📚 Introduction to the AP Physics Experiment
This paragraph introduces the AP Physics workbook's unit on mechanical waves and sound, focusing on the relationship between wave speed, frequency, and wavelength. The scenario involves designing an experiment with a string and an oscillator to determine the velocity of a standing wave. The setup includes attaching one end of the string to an oscillator and the other to a hanging mass via a pulley. The procedure is to measure the distance from the oscillator to the pulley, increase the oscillator's frequency until a standing wave pattern forms, and record the frequency (f1) at the first harmonic. This process is repeated for higher harmonics, recording the frequencies (f2, f3, f4) and observing the corresponding node and antinode patterns. The paragraph emphasizes the importance of understanding and memorizing the fundamental wavelength and harmonic relationships to analyze the data and calculate the wave's velocity.
🧪 Data Collection and Analysis Method
The second paragraph discusses the methodology for collecting and analyzing data during the oscillation experiment. The student performs the oscillation and records the data in decimal form, which represents the harmonics of the wave. The paragraph explains how to calculate the velocity of the wave using the formula velocity equals lambda times frequency. It also introduces the concept of graphing the wavelength on one axis and frequency on the other to find the area, which represents the velocity. The method of linearization is briefly touched upon, suggesting that it may be necessary for further analysis. The paragraph concludes with an example calculation of the wave's velocity using the collected data.
📈 Plotting and Linearization of Data
This paragraph delves into the specifics of plotting and linearizing the collected data. It explains how to plot points based on frequency and wavelength, and then find the area under the curve to determine the velocity. The paragraph also discusses the concept of taking the square root to linearize the data, transforming the exponential relationship into a linear one. This is done by graphing the reciprocal of the wavelength (1/lambda) against the frequency, which allows for a straight-line representation of the data. The paragraph provides a step-by-step guide on how to write the equation for the line of best fit, which is used to calculate the slope (velocity). It also mentions the importance of linearization when asked to find the line of best fit, as it simplifies the process and allows for easier calculation of the wave's speed.
🕰 Frequency Counting and Final Analysis
The final paragraph focuses on counting the frequency of the waves to complete the analysis. It explains that frequency is the number of wave cycles in a given time and provides a method for counting these cycles over a set period. The paragraph describes how to count the waves in a ten-second interval and use this count to determine the most dominant frequency among the collected data points. It emphasizes the need to identify the data point with the most waves to find the correct frequency. The paragraph concludes by reiterating that the method used to graph the data was not incorrect, but linearization was necessary for writing an equation for the line of best fit, which is a requirement in certain analytical contexts.
Mindmap
Keywords
💡Mechanical Waves
💡Standing Waves
💡Wave Speed
💡Frequency
💡Wavelength
💡Harmonics
💡Nodes and Antinodes
💡Oscillator
💡Pulley System
💡Data Analysis
💡Line of Best Fit
Highlights
The experiment involves a long string attached to an oscillator and a hanging mass, using a pulley system to create standing waves.
The procedure starts by measuring the distance from the oscillator to the start of the pulley.
The frequency on the oscillator is increased until a standing wave pattern forms, starting with the first harmonic.
The first harmonic is centered at one antinode and is the basis for measuring the fundamental wavelength.
The experiment progresses by increasing frequency to produce higher harmonics, recording frequencies for the second, third, and fourth harmonics.
The velocity of the wave on the string is determined by the relationship velocity equals lambda times frequency.
Wavelengths for different harmonics can be calculated based on the fundamental wavelength and the number of antinodes.
The fundamental wavelength is twice the distance between the oscillator and the pulley (2l).
The second harmonic has a wavelength equal to the distance (l) between the oscillator and the pulley.
The third harmonic's wavelength is two-thirds of the distance (2/3l).
The fourth harmonic's wavelength is half the distance (1/2l).
The area under the graph of wavelength versus frequency represents the velocity of the wave.
To analyze the data, one can graph wavelength on one axis and frequency on the other, with the area representing velocity.
An alternative method for data analysis is to linearize the data by graphing the inverse of the wavelength (1/lambda) against frequency.
The line of best fit can be determined by the slope of the linearized graph, which gives the velocity of the wave.
The experiment demonstrates a practical application of wave mechanics principles, specifically the relationship between wave speed, frequency, and wavelength.
The method can be used to determine the velocity of waves in various mediums by applying the same principles.
The experiment provides a visual and quantitative understanding of harmonics and their relationship to wavelength and frequency.
Transcripts
Browse More Related Video
2015 #5 Free Response Question - AP Physics 1 - Exam Solution
High School Physics - The Wave Equation

Standing Waves on a String, Fundamental Frequency, Harmonics, Overtones, Nodes, Antinodes, Physics
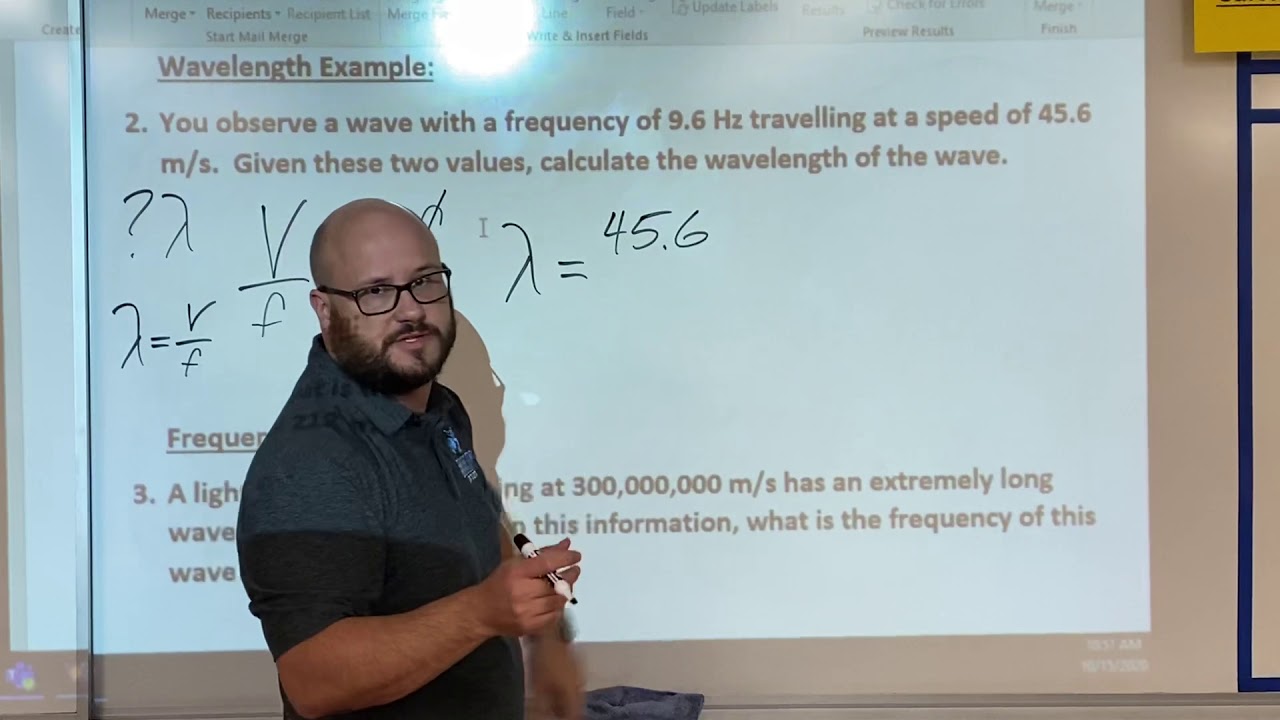
How to calculate wave speed, wavelength, and frequency.
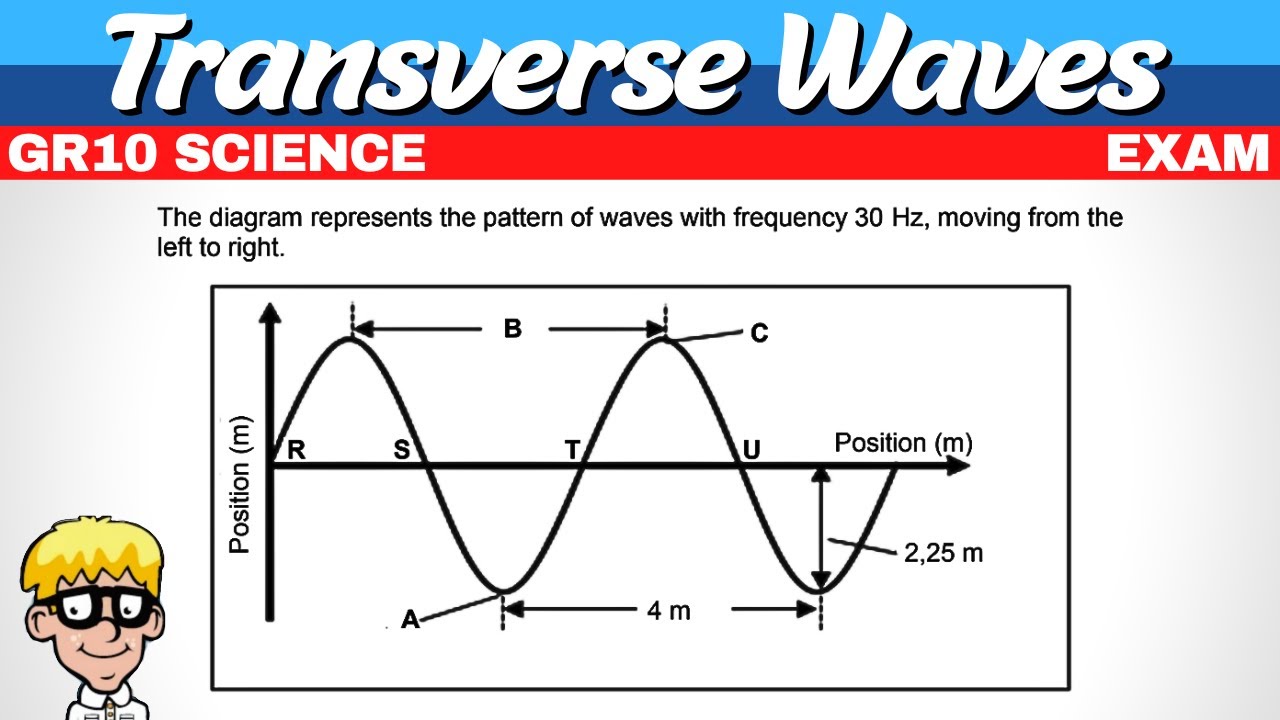
Exam Transverse Waves Grade 10
Wave Speed Practice Problems v2
5.0 / 5 (0 votes)
Thanks for rating: