Linearity and Nonlinearity in Linear Regression | Statistics Tutorial #33 | MarinStatsLectures
TLDRThe video discusses strategies for addressing non-linearity in simple linear regression, emphasizing the importance of meeting the assumption of linearity. It introduces various approaches such as transforming the Y variable (e.g., using log or square root), transforming the X variable, using polynomial or quadratic models, categorizing continuous variables, and considering more complex models like splines. Each method has its pros and cons, including interpretability and flexibility, and none is universally superior. The video encourages further exploration with different datasets to understand how these transformations affect the relationship between variables.
Takeaways
- 📈 Linear regression assumes a linear relationship between the independent variable (X) and the dependent variable (Y).
- 🔍 To address non-linearity, one can transform the Y variable using methods like taking the log, square root, or other power transformations.
- 📊 Transforming Y can help with the assumption of constant variance (homoscedasticity) by reducing the variability in Y values across different levels of X.
- 🤔 Transforming Y may reduce interpretability, especially in effect size models where the goal is to estimate the slope's meaning.
- 🔄 Transforming the X variable is another approach to address non-linearity, with options like the log, square root, or polynomial transformations.
- 🏗️ The ladder of transformations provides guidance on which transformations to try based on the shape of the non-linear relationship.
- 📊 Polynomial regression, such as fitting a quadratic curve, can capture more complex relationships but may lose interpretability.
- 📈 Categorizing the X variable can be a flexible way to address non-linearity, but it involves some loss of information due to binning continuous data.
- 📊 Choosing the right cut points for categorization is crucial as it can slightly change the model's predictions.
- 🔧 Nonlinear regression models like splines offer a high degree of flexibility but lack a simple mathematical function for interpretation.
- 🚀 Each approach has its pros and cons, and none is universally better than the others; the choice depends on the specific context and goals of the analysis.
- 📚 Further exploration and understanding of each method are necessary to effectively address non-linearity in linear regression models.
Q & A
What is the primary assumption that must be met for linear regression to be effectively used?
-The primary assumption for linear regression is linearity, meaning the relationship between the independent variable (X) and the dependent variable (Y) must be linear or can be represented using a straight line.
What are some common transformations applied to address non-linearity in simple linear regression?
-Common transformations to address non-linearity include taking the logarithm, square root, or other power transformations of the dependent variable (Y), or applying transformations to the independent variable (X) like the log, square root, or polynomial transformations.
How do logarithmic transformations affect the scale of data?
-Logarithmic transformations stretch out the space for smaller numbers and squish the space for larger numbers, effectively moving from a multiplicative scale to an additive scale.
What is the 'ladder of transformations' and how does it help in addressing non-linearity?
-The 'ladder of transformations' is a guide that suggests different transformations for X or Y based on the pattern of non-linearity observed in the data. It helps to identify which transformations might make the relationship between variables appear more linear.
What are the advantages and disadvantages of transforming the Y variable in linear regression?
-Advantages include the ability to address non-linear relationships and potentially fix increasing variance issues. Disadvantages involve loss of interpretability, especially in effect size models, where the transformed slope may not have a clear practical meaning.
What is a polynomial regression and how does it differ from simple linear regression?
-Polynomial regression involves fitting a curve, rather than a straight line, to the data by including powers of the independent variable (X). It can capture more complex relationships, such as quadratic or parabolic shapes, unlike simple linear regression which assumes a straight line relationship.
What are the limitations of using polynomial regression to address non-linearity?
-While polynomial regression can fit a wide range of quadratic or polynomial growth patterns, it may not work well for all types of non-linear relationships, especially those with abrupt changes or explosions in growth.
How does categorizing the independent variable (X) help in addressing non-linearity?
-Categorizing X allows the model to estimate different intercepts for different categories, effectively accounting for non-linear effects without assuming a specific functional form. This approach is flexible and can handle complex relationships but may result in information loss due to the binning of continuous data into categories.
What is a spline regression and how does it differ from other approaches to non-linearity?
-Spline regression is a non-linear regression model that allows the fitted line to 'wiggle' or bend at any point, offering a high degree of flexibility. Unlike other approaches that may have limitations with certain types of non-linear relationships, spline regression can theoretically fit any shape but lacks a simple mathematical function and interpretable coefficients.
Why is it important to choose appropriate cut points when categorizing a continuous variable?
-Choosing appropriate cut points is crucial because it determines how the continuous variable is divided into categories, which can significantly impact the model's interpretation and predictions. Different cut points can lead to different model outcomes.
What should one consider when deciding between different approaches to address non-linearity in regression?
-The choice of approach should be based on the specific characteristics of the data and the goals of the analysis. Factors to consider include the type of non-linearity present, the need for interpretability, the potential loss of information, and the flexibility and complexity of the model.
Outlines
📊 Addressing Nonlinearity in Linear Regression
This paragraph discusses the challenge of addressing nonlinearity in linear regression, emphasizing the importance of the linearity assumption. It introduces the concept of using transformations on the Y variable, such as taking the log, to create a linear relationship. The paragraph also highlights the pros and cons of this approach, including the ability to address increasing variance and the loss of interpretability in effect size models.
📈 Transforming Y and X Variables
The second paragraph explores the option of transforming both Y and X variables to achieve linearity in the relationship. It discusses the benefits of various transformations, such as the log, square root, or higher powers of X, and how they can help address certain types of nonlinearities. The paragraph also notes the limitations, such as the loss of interpretability in effect size models and the inability of transformations to address all types of nonlinear relationships.
📉 Polynomial and Quadratic Regression
This paragraph introduces polynomial and quadratic regression as methods to fit a curve rather than a straight line to the data. It explains how including terms like X squared allows for the fitting of parabolic shapes and discusses the pros and cons of this approach. The benefits include its applicability to many natural phenomena, while the cons involve the loss of interpretability and the potential complexity of higher-order terms.
🔢 Categorizing Continuous Variables
The fourth paragraph discusses the strategy of categorizing continuous variables, such as experience, to address nonlinearity. It explains how this approach involves creating categories and using indicator variables in the regression model. The paragraph outlines the flexibility of this method but also warns of the information loss that occurs when continuous data is binned into categories and the need for careful selection of cut points.
🌐 Nonlinear Regression and Other Approaches
The final paragraph briefly mentions nonlinear regression models and splines as alternative approaches to handling nonlinearity. It notes the flexibility of these models to fit any shape but also highlights the lack of a functional form, which can make interpretation of coefficients more challenging. The paragraph concludes by emphasizing that no single approach is universally superior, and each has its own set of advantages and disadvantages.
Mindmap
Keywords
💡non-linearity
💡linear regression
💡assumptions
💡log transformation
💡constant variance
💡interpretability
💡transforming X
💡polynomial regression
💡categorization
💡indicator variables
💡nonlinear regression
Highlights
Linear regression requires the assumption of linearity between the independent variable (X) and the dependent variable (Y).
The importance of checking assumptions before using linear regression is emphasized, including visual checks for linearity.
A non-linear relationship between X and Y can lead to poor model fit, regardless of whether the goal is prediction or estimating effect sizes.
One approach to address non-linearity is to transform the Y variable, such as using the natural logarithm.
Transformations like the log of Y can help address non-constant variance in the data, improving the model fit.
However, transforming Y can lead to a loss of interpretability, especially in effect size models.
Transforming the X variable is another approach to dealing with non-linearity, with options like the log, square root, or higher powers of X.
The ladder of transformations provides guidance on which transformations to try based on the shape of the non-linearity.
Polynomial regression, including quadratic terms, can fit more complex non-linear relationships.
Polynomial regression allows for inflection points, enabling the model to capture more intricate patterns.
Categorizing the X variable is a method to address non-linearity, particularly useful for dealing with categorical data.
Categorization of X can lead to flexibility in modeling but also results in information loss.
Careful selection of cut points for categorization is crucial as it can slightly alter the model.
Nonlinear regression models, such as splines, offer a flexible approach to fitting data with any shape.
Spline models do not have a fixed functional form, which can make interpretation of coefficients more challenging.
The transcript provides an overview of common approaches to addressing non-linearity in regression, with details left to be explored further.
The choice of method to address non-linearity depends on the specific characteristics of the data and the goals of the analysis.
Transcripts
Browse More Related Video

REGRESSION: Non-Linear relationships & Logarithms
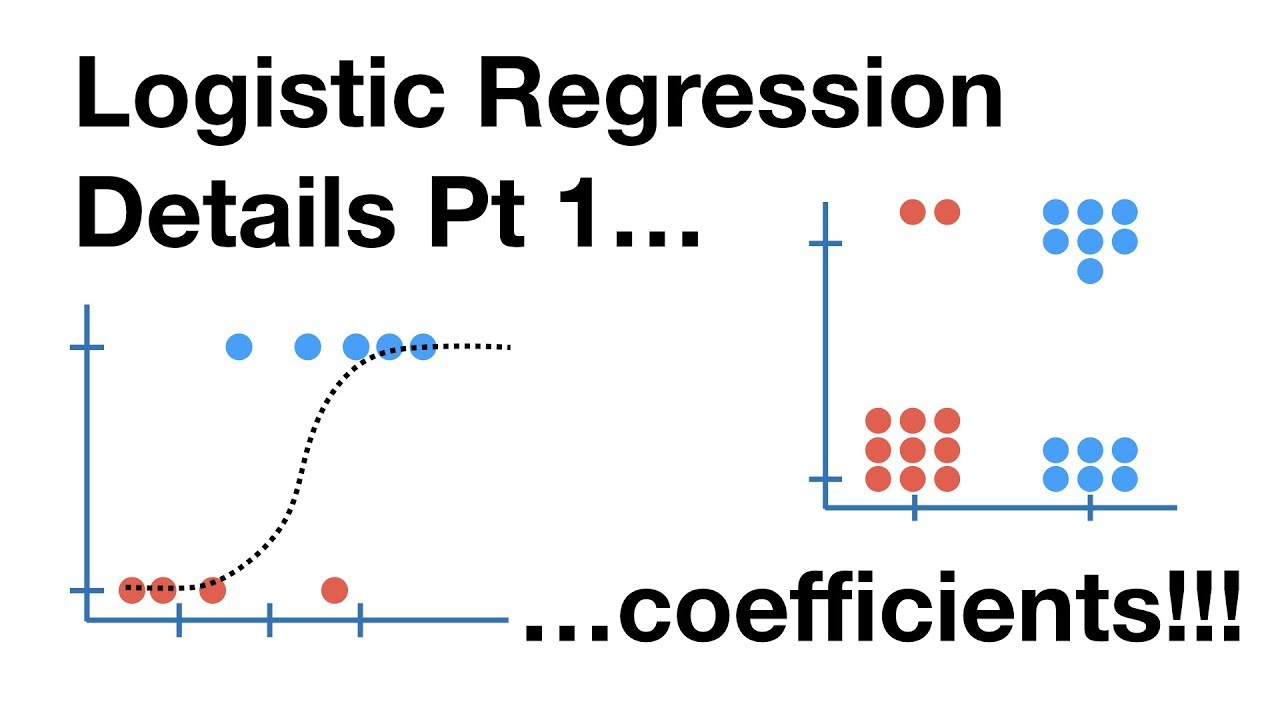
Logistic Regression Details Pt1: Coefficients

Changing Numeric Variable to Categorical in R | R Tutorial 5.4 | MarinStatsLectures

Video 1: Introduction to Simple Linear Regression
Including Variables/ Factors in Regression with R, Part I | R Tutorial 5.7 | MarinStatsLectures

Statistics 101: Multiple Linear Regression, The Very Basics 📈
5.0 / 5 (0 votes)
Thanks for rating: