Likelihood Ratios Explained
TLDRThis video tutorial explains the concept of likelihood ratios, which are valuable tools in medical diagnostics, summarizing sensitivity and specificity data. It details how to calculate positive (LR+) and negative (LR-) likelihood ratios and emphasizes their importance in interpreting test results. The video uses the example of an ACL tear diagnosis to illustrate the practical application of likelihood ratios in adjusting pre-test probabilities to post-test probabilities, ultimately aiding clinicians in evidence-based decision-making.
Takeaways
- 📚 Understanding likelihood ratios requires prior knowledge of sensitivity, specificity, and positive/negative predictive values.
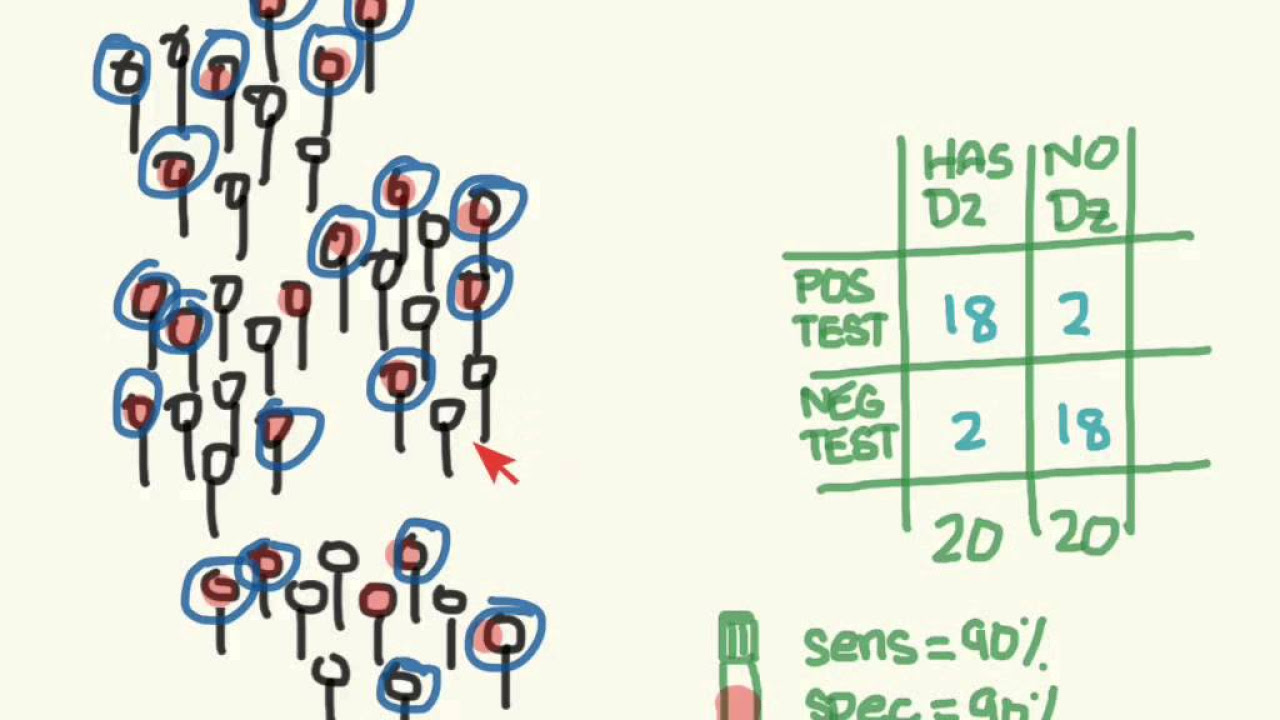
- 🔍 Likelihood ratios condense sensitivity and specificity information, comparing the likelihood of test results in diseased vs. non-diseased individuals.
- ✅ Positive likelihood ratio (LR+) is calculated as sensitivity divided by (1 - specificity), while negative likelihood ratio (LR-) is (1 - sensitivity) divided by specificity.
- 🚀 A good LR+ is greater than 10, and a good LR- is less than 0.1, indicating the test's effectiveness in confirming or ruling out a disease.
- 📏 A likelihood ratio close to 1.0 suggests the test has minimal impact on determining the presence or absence of a disease, making it practically useless.
- 🩺 Practical application: Use LRs with prevalence, symptoms, and other clinical findings to estimate the probability of a condition, such as an ACL tear.
- 📈 Use a nomogram to visually determine post-test probabilities by plotting pre-test probability and likelihood ratios.
- 🧠 Convert pre-test probability to odds (probability/(1 - probability)) to use in likelihood ratio calculations.
- 🔢 For positive tests, multiply pre-test odds by the positive likelihood ratio to get post-test odds, then convert back to probability.
- 🔄 For negative tests, multiply pre-test odds by the negative likelihood ratio to find post-test odds, then convert to probability.
- 📈 In the given example, a positive Lachman test increases the probability of an ACL tear from 60% to 95%, while a negative test reduces it to 19%.
- 🎯 Choose tests with the highest positive likelihood ratio to confirm a hypothesis and the lowest negative likelihood ratio to refute it.
Q & A
What are likelihood ratios and why are they important in medical testing?
-Likelihood ratios summarize the information contained in sensitivity and specificity of a medical test, indicating how likely a test result is in people with the disease compared to those without it. They are important because they help in interpreting the results of diagnostic tests and their impact on the probability of a patient having a disease.
How are positive and negative likelihood ratios calculated?
-The positive likelihood ratio (LR+) is calculated by dividing the sensitivity by (1 - specificity), and the negative likelihood ratio (LR-) is calculated by dividing (1 - sensitivity) by specificity.
What do good positive and negative likelihood ratios values indicate?
-A good positive likelihood ratio is one that is greater than 10, indicating a strong association between the test result and the presence of the disease. A good negative likelihood ratio is one that is less than 0.1, indicating a strong association between the test result and the absence of the disease.
What does a likelihood ratio close to 1.0 signify?
-A likelihood ratio close to 1.0 indicates that the test has very little influence on determining whether a patient has or does not have the disease, making it practically useless in clinical practice.
How is the prevalence of an ACL tear used in the example?
-The prevalence of an ACL tear, which is 5% based on literature, serves as a starting point to estimate the probability of an ACL tear before additional information is gathered from the patient's history and physical examination.
What signs and symptoms are used to estimate the chance for an ACL tear?
-Signs and symptoms such as an audible pop during a soccer match, immediate swelling, hemarthrosis, and a feeling of instability are used to estimate the chance for an ACL tear.
How do you use likelihood ratios in practice to determine post-test probability?
-In practice, you use likelihood ratios in conjunction with the pre-test probability to determine the post-test probability. This is done by using a nomogram or by calculating the post-test odds and then converting them back to probabilities.
What were the sensitivity and specificity of the Lachman test in the example?
-In the example, the Lachman test had a sensitivity of 85% and a specificity of 94%.
What were the positive and negative likelihood ratios for the Lachman test?
-The positive likelihood ratio for the Lachman test was 14, and the negative likelihood ratio was 0.16.
How does the nomogram help in determining post-test probability?
-The nomogram helps by allowing you to mark the pre-test probability and the likelihood ratio on the nomogram, then drawing a line through these two points to determine the post-test probability in percentages.
What is the final post-test probability for a positive Lachman test in the example?
-In the example, the final post-test probability for a positive Lachman test was around 95%.
What is the final post-test probability for a negative Lachman test in the example?
-In the example, the final post-test probability for a negative Lachman test was about 18%.
Outlines
📈 Introduction to Likelihood Ratios and Calculation
This paragraph introduces the concept of likelihood ratios, emphasizing their importance in medical diagnostics. It explains that likelihood ratios encapsulate the information from sensitivity and specificity, providing a measure of how predictive a test result is for individuals with or without a disease. The positive likelihood ratio (LR+) is calculated as sensitivity divided by (1 - specificity), and the negative likelihood ratio (LR-) as (1 - sensitivity) divided by specificity. A good LR+ is greater than 10, and a good LR- is less than 0.1. The paragraph also discusses the practical application of these ratios, using the example of an ACL tear diagnosis, including the prevalence, symptoms, and the use of the Lachman test with its associated likelihood ratios to determine post-test probabilities.
🧠 Post-Test Probability Calculation and Practical Application
This paragraph delves into the practical application of likelihood ratios by explaining how to calculate post-test probabilities. It uses the ACL tear example to illustrate the process, starting with a pretest probability and adjusting it based on the positive and negative likelihood ratios of the Lachman test. The paragraph outlines the use of a nomogram for quick probability estimation and provides a step-by-step guide on converting pretest probability to odds, calculating post-test odds, and finally converting these odds back to a probability. The summary highlights the importance of using tests with the highest positive likelihood ratio to confirm a diagnosis and those with the lowest negative likelihood ratio to rule out a condition.
Mindmap
Keywords
💡Likelihood Ratios
💡Sensitivity
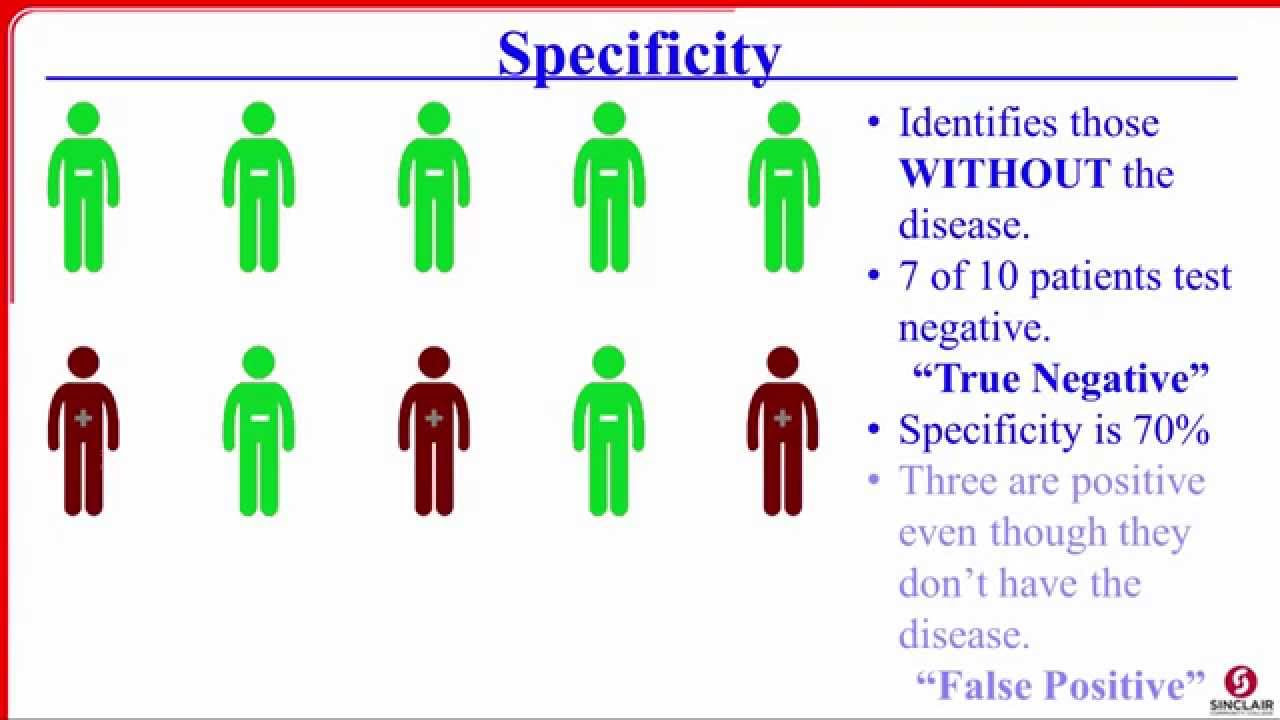
💡Specificity
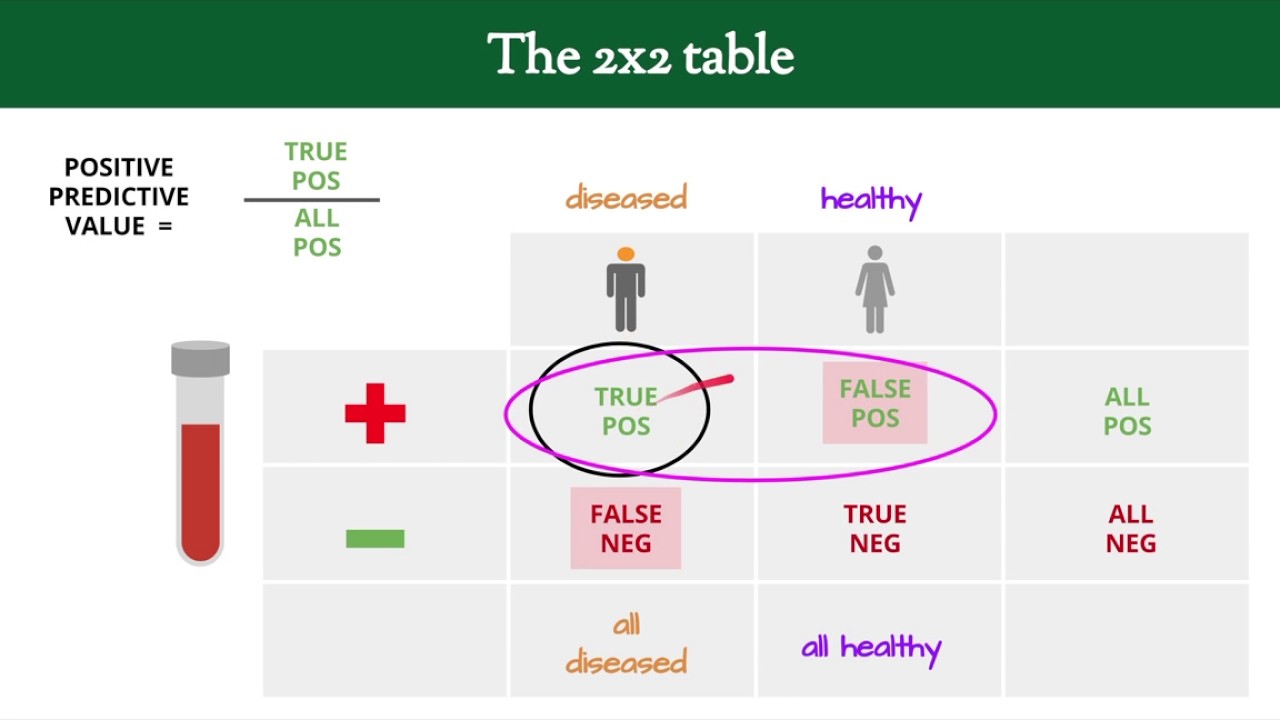
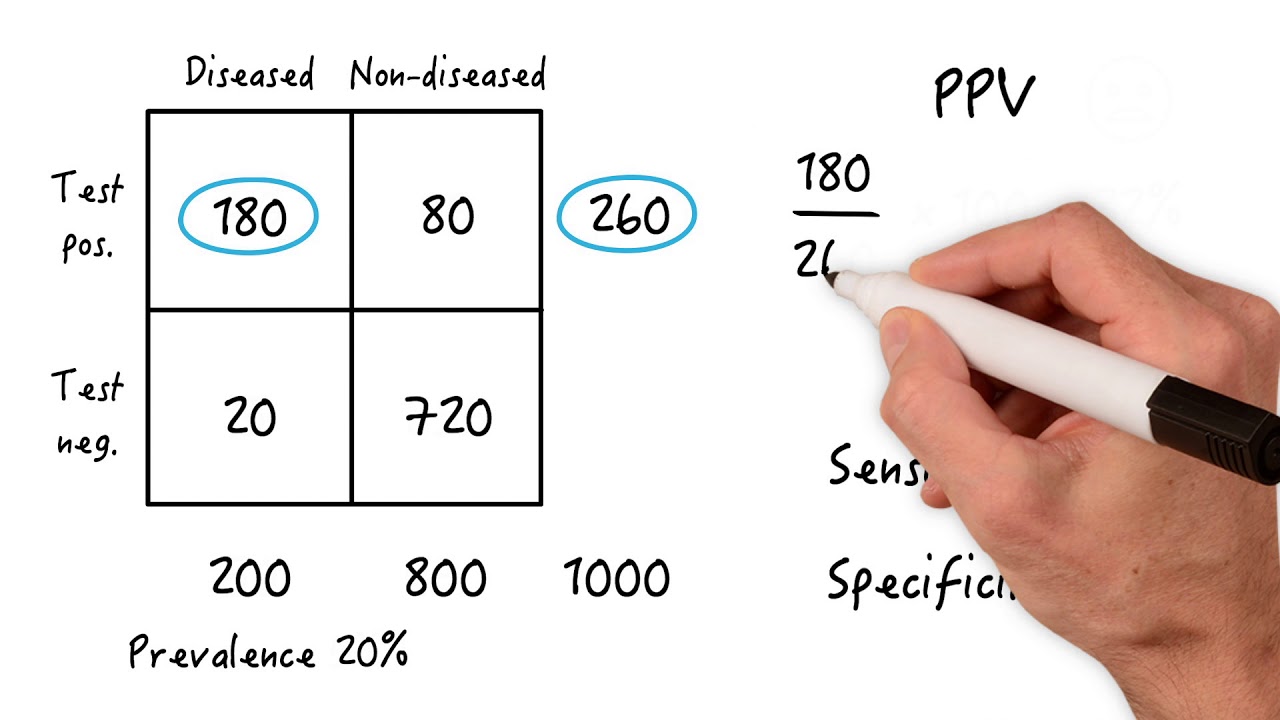
💡Positive Predictive Value
💡Negative Predictive Value
💡Prevalence
💡Ottawa Knee Rules
💡Lachman Test
💡Post-Test Probability
💡Nomogram
💡Evidence-Based Practice
Highlights
Likelihood ratios summarize sensitivity and specificity, providing a measure of how likely a test result is in people with or without the disease.
Positive likelihood ratio (LR+) is calculated by dividing sensitivity by (1 - specificity).
Negative likelihood ratio (LR-) is calculated using (1 - sensitivity) divided by specificity.
A good positive likelihood ratio is one greater than 10, and a good negative likelihood ratio is one less than 0.1.
A likelihood ratio close to 1.0 indicates the test has minimal influence on determining the presence or absence of the disease.
In practice, a test with a likelihood ratio near 1.0 is considered useless.
The prevalence of an ACL tear is approximately 5% based on literature.
Signs and symptoms such as an audible pop, immediate swelling, hemarthrosis, and instability can indicate an ACL tear.
The Ottawa knee rules help exclude a knee fracture.
The Lachman test has a sensitivity of 85% and a specificity of 94%, resulting in a positive likelihood ratio of 14 and a negative likelihood ratio of 0.16.
A nomogram can be used to quickly determine the post-test probability of a test in percentages.
The post-test probability for a positive Lachman test is approximately 95%, and for a negative Lachman test, it's about 18%.
To calculate post-test probability, convert the pretest probability to pretest odds by dividing it by (1 - pretest probability).
Post-test odds are calculated by multiplying pretest odds with the positive likelihood ratio for a positive test.
Post-test probability is found by dividing post-test odds by (post-test odds + 1).
A positive test result increases the probability of an ACL tear from 60% to 95%.
A negative test result decreases the probability of an ACL tear to 19%.
Use the test with the highest positive likelihood ratio to confirm a hypothesis and the test with the lowest negative likelihood ratio to reject it.
Transcripts


5.0 / 5 (0 votes)
Thanks for rating: