Calculus - The Fundamental Theorem, Part 2
TLDRThe video script delves into the Fundamental Theorem of Calculus, illustrating how the integral from A to B of a function f(x) represents the area under the curve. It explains the concept of the anti-derivative, G, which is the rate at which the area changes with respect to x. The script uses a graphical approach to show that as x increases, the area enclosed by the function and the axis expands at varying rates, depending on the value of f(x) at different points. The area function, derived from the anti-derivative, is demonstrated to increase continuously, with its rate of change reflecting the height of the function at any given x-value.
Takeaways
- 📚 The Fundamental Theorem of Calculus establishes a relationship between integration and differentiation, stating that the integral of a function from A to B can be found by subtracting the anti-derivative at A from the anti-derivative at B.
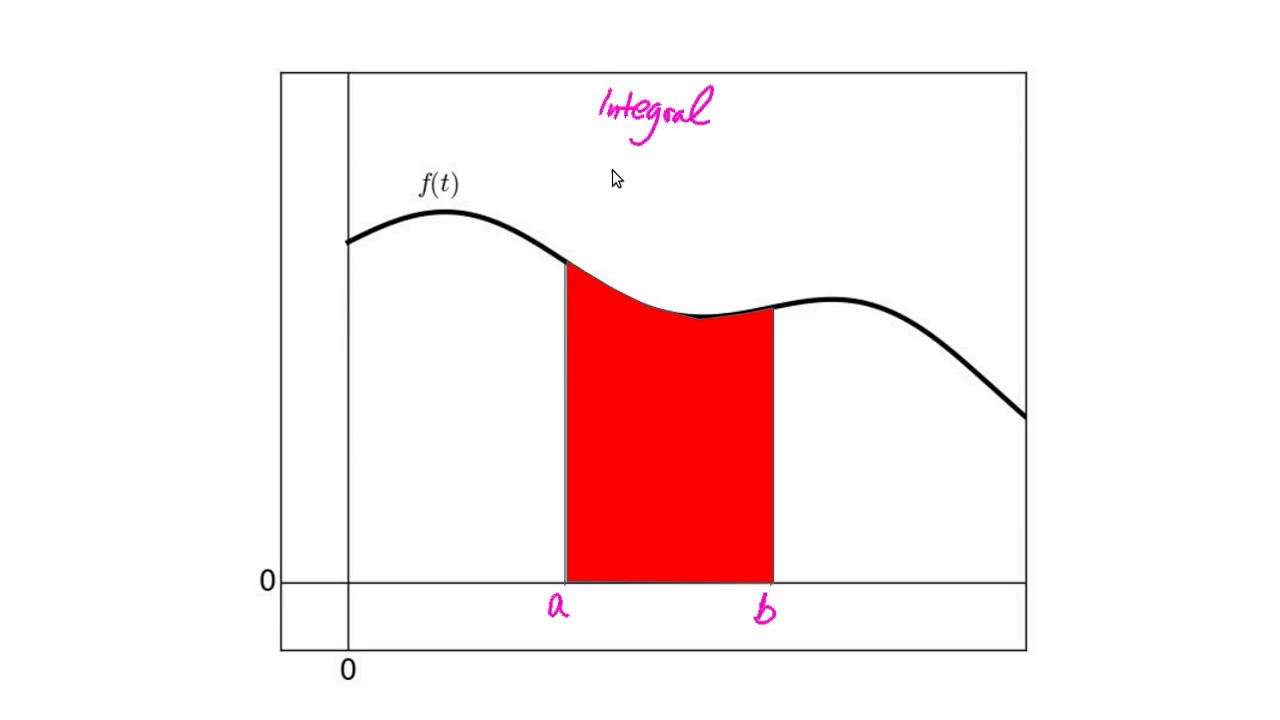
- 📈 The area under a curve from points A to B is represented by the integral of the function over that interval and is equivalent to the difference in the anti-derivative's values at those points.
- 📊 The concept of the area function is introduced as a function of X, which changes as X varies, indicating the enclosed area under the curve at different points.
- 🔍 The rate of change of the area function is directly related to the value of the function at a given point X; higher values of the function lead to a faster increase in the area.
- 📉 Conversely, when the function's value is low, the area increases more slowly, reflecting the function's impact on the rate of area accumulation.
- 📝 The area function is graphed starting from zero, as the total enclosed area at the beginning (when X is zero) is zero, and it increases as X moves to the right.
- 📉 The graph of the area function is always increasing, reflecting the continuous accumulation of area as X increases, but at varying rates.
- 📶 The steepest part of the area function's graph corresponds to the point where the original function has its peak value, indicating the fastest rate of area increase.
- 📈 The area function's rate of increase slows down as the original function's value decreases, indicating a direct relationship between the function's value and the rate of area change.
- 📚 The video script promises to show examples in the next video that demonstrate the area function is indeed the anti-derivative of the original function.
- 🤔 The explanation emphasizes understanding the visual and conceptual relationship between a function, its rate of change, and the area under its curve, highlighting the importance of the anti-derivative in calculating this area.
Q & A
What is the Fundamental Theorem of Calculus?
-The Fundamental Theorem of Calculus states that the definite integral of a function from point A to B, denoted as the integral from A to B of f(x) dx, is equal to the difference of the anti-derivative G(B) and G(A), where G is the antiderivative of f.
What does the left side of the Fundamental Theorem of Calculus represent?
-The left side of the theorem represents the area under the curve of the function f(x) from points A to B.
What is an anti-derivative?
-An anti-derivative is a function G(x) that, when differentiated, gives back the original function f(x), i.e., the derivative of G(x) is f(x).
Why does the area under a curve change as x changes?
-The area under a curve changes as x changes because the height of the function f(x) at different x values determines the rate at which the area increases.
How does the rate of change of the area under the curve relate to the value of the function at a given x?
-The rate of change of the area is directly related to the value of the function at a given x. A higher value of f(x) at a certain x means the area is increasing more rapidly at that point.
What happens to the area under the curve as x increases from a certain point?
-As x increases from a certain point, the area under the curve increases, but the rate of this increase can vary depending on the value of the function f(x) at different x values.
What is the significance of the function f(x) being always above the x-axis in the context of the area under the curve?
-If the function f(x) is always above the x-axis, it means that as x increases, the area under the curve is always increasing, without any negative contributions to the area.
How does the graph of the area function a(x) as a function of x look like according to the script?
-The graph of the area function a(x) as a function of x starts at zero and increases over time, with varying rates of increase that correspond to the values of f(x).
Why does the rate of increase of the area function a(x) correspond to the peak of f(x)?
-The rate of increase of the area function a(x) corresponds to the peak of f(x) because at the peak, the height of f(x) is the greatest, thus contributing the most to the area under the curve at that x value.
What does the script suggest about the relationship between the area function and the anti-derivative of f(x)?
-The script suggests that the area function, which represents the accumulated area under the curve of f(x), is in fact the anti-derivative of f(x).
What will be shown in the next video according to the script?
-In the next video, examples will be provided to demonstrate that the area function is indeed the anti-derivative of the function f(x).
Outlines
📚 Introduction to the Fundamental Theorem of Calculus
This paragraph introduces the Fundamental Theorem of Calculus, which links the concept of integration to anti-derivatives. It explains that the integral from point A to B of a function f(x) is equal to the difference of the anti-derivative G evaluated at B and A. The paragraph uses a graphical approach to illustrate how the area under the curve of a function changes with respect to x, emphasizing that this area can be considered a function of x itself, with varying rates of change. The explanation is foundational, setting the stage for a deeper understanding of the relationship between integration and anti-derivatives.
📈 Visualizing the Rate of Change of Area Under a Curve
Building on the introduction, this paragraph delves into the visualization of the area under a curve as a function of x, highlighting how the rate of change of this area varies depending on the value of x. It discusses how the area increases at different rates, especially pointing out that the rate is fastest at points where the function's value is high and slowest where the function's value is low. The paragraph also introduces the concept of graphing this area function, showing it as an increasing function that accelerates and decelerates based on the function's height at different x values. The summary aims to clarify the dynamic nature of the area function and its connection to the original function f(x).
Mindmap
Keywords
💡Fundamental Theorem of Calculus
💡Integral
💡Anti-derivative
💡Rate of Change
💡Graph
💡Area Function
💡Vertical Line
💡Function
💡Peak
💡Y-axis
💡X-axis
Highlights
Introduction to the fundamental theorem of calculus, which connects the integral of a function to its anti-derivative.
Explanation of the integral as the area under the curve from points A to B.
The integral is equal to the difference of the anti-derivatives evaluated at B and A.
Visualization of the area as a function of X, changing with the value of X.
The rate of change of the area as X increases, which is related to the height of the function.
The area function's rate of change varies depending on the value of the function at a given X.
Graphing the area function as it increases at different rates corresponding to the function's height.
The area function starts at zero and increases as X moves to the right.
The steepest increase in the area function corresponds to the peak of the original function.
The slowest increase in the area function is when the original function's value is at its lowest.
The area function continues to increase even after reaching its slowest rate.
The area function's rate of increase can be determined exactly through anti-derivatives.
The area under the function f is another function of X, which is its anti-derivative.
Upcoming examples will demonstrate that the area function is indeed the anti-derivative of f.
The importance of understanding the relationship between the integral and the anti-derivative for calculus.
The practical application of the fundamental theorem of calculus in calculating areas and rates of change.
Transcripts
Browse More Related Video

An Intuitive Understanding of the Fundamental Theorem of Calculus
Why Are Slope and Area Opposite: The Fundamental Theorem of Calculus
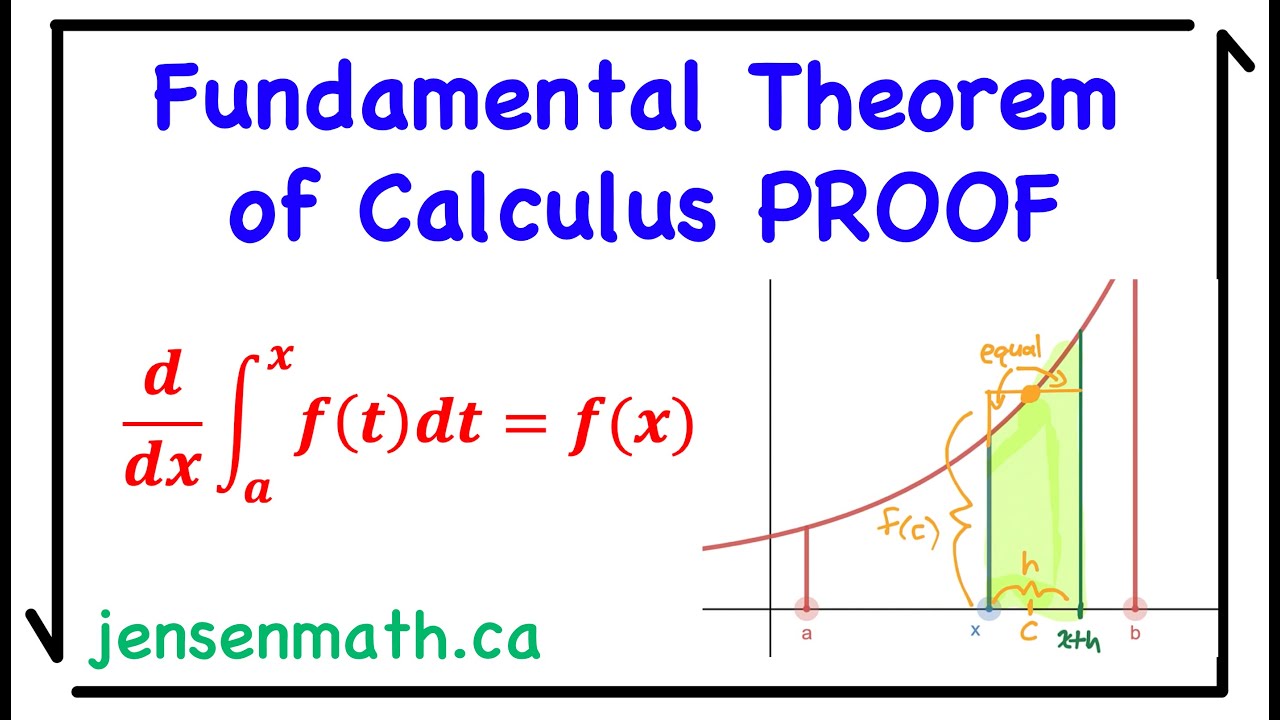
1st Fundamental Theorem of Calculus PROOF | Calculus 1 | jensenmath.ca
Area between a curve and the x-axis: negative area | AP Calculus AB | Khan Academy

Fundamental theorem of calculus (Part 1) | AP Calculus AB | Khan Academy

2022 AP Calculus AB Free Response #2
5.0 / 5 (0 votes)
Thanks for rating: