Managerial Economics 2.1: Demand Functions
TLDRIn this managerial economics video, Sebastian Y reviews microeconomics fundamentals, focusing on demand and its determinants. He explains the law of demand, introduces the ceteris paribus concept, and uses a demand function to illustrate the negative relationship between price and quantity demanded. Factors affecting demand, such as income, prices of related goods, consumer tastes, and population changes, are discussed. The video also covers consumer surplus and its calculation, providing a comprehensive foundation for further economic analysis.
Takeaways
- 📈 Managerial economics involves reviewing microeconomics fundamentals like supply, demand, and elasticity, incorporating calculus.
- 📉 The concept of 'ceteris paribus' means holding all other variables constant when examining economic systems.
- 📊 The law of demand states that as price increases, the quantity demanded decreases, and vice versa.
- 📉 Demand functions represent the relationship between quantity demanded and price, often graphed with price on the vertical axis and quantity on the horizontal.
- 📉 Graphing demand functions involves determining the intercepts by setting price or quantity to zero.
- 📉 Changes in factors like consumer income, prices of related goods, and tastes can shift the demand curve to the right (increase) or left (decrease).
- 💰 Consumer surplus is the difference between what consumers are willing to pay and what they actually pay, represented as the area under the demand curve and above the price.
- 📊 A linear demand function can include multiple variables like price, income, advertising, and prices of related goods.
- 📉 Calculating demand shifts involves adjusting variables in the demand function and re-evaluating the intercepts and curve.
- 📉 Consumer surplus can be calculated as the area of a triangle under the demand curve, which changes as the price changes.
Q & A
What is the term 'caterous paribus' and why is it important in economic analysis?
-Caterous paribus is a Latin phrase meaning 'all else equal'. It is important in economic analysis because it allows economists to isolate the effect of one variable on an economic system while holding all other variables constant, simplifying the examination of complex economic systems.
What is the law of demand and how is it represented mathematically?
-The law of demand states that as the price of a good increases, the quantity demanded decreases, and vice versa. Mathematically, it is represented using a demand function, which shows the relationship between the quantity demanded and the price of the good, typically with a negative slope indicating the inverse relationship.
Can you explain the concept of diminishing marginal benefit in the context of demand?
-Diminishing marginal benefit refers to the idea that as more units of a good are consumed, each additional unit provides less additional satisfaction or utility than the previous one. This concept is related to the law of demand as it suggests that at higher quantities, consumers are willing to pay less for each additional unit.
How is the demand function graphed and what does its slope indicate?
-The demand function is graphed by plotting price on the vertical axis and quantity on the horizontal axis. The slope of the demand function is negative, indicating that as price increases, the quantity demanded decreases, which aligns with the law of demand.
What are the intercepts of a demand function and how are they calculated?
-The intercepts of a demand function are the points where the function crosses the axes. The quantity intercept is found by setting the price (P) to zero and solving for quantity (Q), while the price intercept is found by setting the quantity to zero and solving for price.
What factors can cause the demand curve to shift, and in which direction does each factor typically shift the curve?
-Factors such as consumer income, price of related goods, changes in taste, advertising, and population changes can shift the demand curve. An increase in income typically shifts the curve to the right for normal goods, while an increase in the price of a substitute good also shifts the demand curve to the right. Conversely, a decrease in income for inferior goods or an increase in the price of a complement good shifts the curve to the left.
How does the price of a substitute good affect the demand for another good?
-If the price of a substitute good increases, the demand for the other good generally increases as well, shifting the demand curve to the right. This is because consumers tend to switch to the less expensive substitute when the price of one alternative goes up.
What is the difference between normal goods and inferior goods in terms of their demand response to income changes?
-For normal goods, an increase in consumer income leads to an increase in demand, shifting the demand curve to the right, while a decrease in income has the opposite effect. For inferior goods, the relationship is reversed: an increase in income decreases demand, shifting the curve to the left, and a decrease in income increases demand, shifting the curve to the right.
How can advertising influence the demand for a product?
-Advertising can increase the awareness and perceived value of a product, which tends to increase its demand. This is reflected in the demand function by a positive coefficient for the advertising variable, indicating that an increase in advertising leads to a rightward shift of the demand curve.
What is consumer surplus and how is it represented graphically?
-Consumer surplus is the difference between the price consumers are willing to pay for a good and the price they actually pay. Graphically, it is represented by the area below the demand curve and above the market price up to the quantity demanded at that price, typically forming a triangular shape under a linear demand curve.
How does the concept of consumer surplus relate to the price of a good?
-As the price of a good decreases, the base and height of the consumer surplus triangle increase, leading to a larger consumer surplus. This shows that consumers benefit more when they pay less for a good, as they receive more value for their money.
Outlines
📚 Introduction to Managerial Economics and Demand
Sebastian Y introduces the topic of managerial economics, focusing on the fundamentals of microeconomics, specifically supply and demand, and the concept of elasticity. He emphasizes the importance of the ceteris paribus assumption, which allows for the analysis of economic systems by changing one variable while holding others constant. The law of demand is discussed, stating that as price increases, the quantity demanded decreases, and vice versa. This is attributed to varying willingness to pay at different price levels and the concept of diminishing marginal benefit. The mathematical representation of demand through a demand function is introduced, using an example to illustrate the negative relationship between price and quantity demanded. The process of graphing demand functions and determining intercepts is explained, demonstrating how changes in price affect quantity demanded along the curve and how shifts in the demand curve represent changes in demand due to factors other than price.
📈 Factors Influencing Demand and Complex Demand Functions
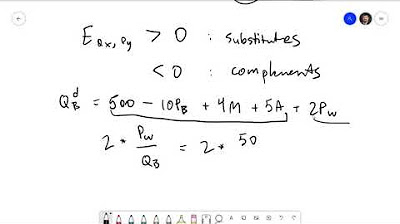
The paragraph delves into factors that can shift the demand curve, such as consumer income, the price of related goods, changes in taste, advertising, and population changes. It explains how income affects demand differently for normal and inferior goods, and how the price changes of substitutes and complements impact the demand for related goods. The concept of consumer surplus is introduced as the difference between what consumers are willing to pay and the actual price they pay. The paragraph also discusses the construction of a more complex demand function that incorporates multiple variables, such as price, income, advertising, and the price of related goods, using coefficients to represent their impact on quantity demanded. An example of a linear demand function for beer is provided, illustrating how to calculate and graph demand with specified variable values, and how changes in income can shift the demand curve.
📉 Consumer Surplus and Its Dependency on Price
This section explains the concept of consumer surplus, which is the area representing the difference between consumers' willingness to pay and the market price. The calculation of consumer surplus is demonstrated through a graphical representation, showing how it forms a triangular area under the demand curve and above the market price. The area of this triangle, representing consumer surplus, is calculated using the formula for the area of a triangle (base times height divided by two). The impact of price changes on consumer surplus is highlighted, showing that as the price decreases, the consumer surplus increases, and vice versa. The summary concludes by emphasizing the importance of understanding consumer surplus in the context of demand and pricing strategies.
🔚 Conclusion on Demand and Anticipation of Supply Discussion
In the concluding remarks of the script, the focus shifts to summarizing the key points discussed about demand, including the law of demand, the factors influencing demand, the concept of consumer surplus, and the construction of complex demand functions. The paragraph ends with a预告 for the next topic, which is the supply side of the economic model, setting the stage for further exploration into the dynamics of supply and demand in managerial economics.
Mindmap
Keywords
💡Managerial Economics
💡Ceteris Paribus
💡Law of Demand
💡Demand Function
💡Elasticity
💡Substitutes
💡Complements
💡Consumer Surplus
💡Income Effect
💡Advertising
💡Regression Analysis
Highlights
Introduction to Managerial Economics by Sebastian Y.
Review of microeconomics fundamentals including supply and demand.
Introduction to the concept of ceteris paribus for analyzing economic systems.
Explanation of the law of demand and its implications on quantity demanded.
Use of the demand function to represent the relationship between price and quantity demanded.
Graphical representation of a demand function with an example.
Calculation of quantity demanded at a specific price using a demand function.
Discussion on the factors that can shift the demand curve such as income and price of related goods.
Differentiation between normal and inferior goods in terms of their demand response to income changes.
Impact of advertising on demand and its representation in the demand function.
Introduction to consumer surplus and its calculation using the area under the demand curve.
Graphical illustration of consumer surplus at different prices.
Construction of a more complex demand function incorporating multiple variables.
Use of regression analysis to estimate coefficients in a demand function.
Demonstration of how to graph a demand function with multiple variables by holding others constant.
Shift in demand due to changes in variables like income and its impact on the demand curve.
Practical application of demand functions in managerial economics for decision-making.
Transcripts


5.0 / 5 (0 votes)
Thanks for rating: